Editor’s Note: This presentation was given at GraphConnect New York in September 2018.
Presentation Summary
Many healthcare organizations today only see small parts of the healthcare system. Few are taking a long-term holistic approach to gain insights into healthcare. Much of the high costs are driven by the lack of connected information.
In this way, making high-quality predictions on how to improve healthcare for an individual means taking many data points into account. Graphs are rather underutilized in the realm of healthcare, which is unfortunate because healthcare data fits beautifully into a graph structure.
In this post, one of Optum’s distinguished engineer discusses how we’re moving toward further connecting healthcare data. First, they provide some background on graphs and healthcare data, including examples of how this data is highly variable and why it’s difficult to store in traditional rigid relational databases. They then show the benefits of storing healthcare data in a graph, and the ability of graph databases to connect datasets together.
They also discuss the challenges in healthcare today and how graph technologies might be able to help. Moreover, they provide three metaphors in which we can explain graphs to managers. Finally, they conclude with how graphs – in combination with other technologies – are at the heart of solving many of the wicked problems in healthcare.
Full Presentation: Connected Healthcare
Today’s presentation will be on connecting healthcare.
In this post, we’ll delve into the challenges we have in healthcare and why we haven’t picked graph databases for this field in the past. We’re then going to provide a picture of how graphs can help us in healthcare.
Towards the end, we’ll go a little bit into how we’ve developed processes to explain why we need graph databases to healthcare executives. This is important because these executives are often not the people who actually build these systems – they’re the people who decide on which systems to build.
In the end, it’s not a question of whether we understand it; it’s about whether we have the right metaphors to explain it to others. We’ll include a few of these metaphors later on in the post.
Background
If you haven’t heard of Optum, we are effectively the IT division of UnitedHealth Group. Our mission is to help people live healthier and make the health system work better for everyone.
UnitedHealth Group made about 200 billion in revenue in 2017, with over a quarter-million employees and 42,000 IT employees. We spend over a billion dollars a year doing data analytics and have over 3,000 people working in our data science departments.
Most of these people use very traditional, mainframe and relational systems, especially since we acquire a lot of healthcare companies that aren’t on the bleeding edge. However, we purchase them because of their data, and getting access to this data is central to building good predictive models.
At Optum, we’re also working on what’s called the Advanced Technology Collaborative. The word “collaborative” is particularly important because our job is to get all these different organizations that have been acquired to work together. UnitedHealth Group acquires 20 to 30 new companies every year.
These organizations and companies choose to store data in many different ways. We identify six basic high-level patterns, shown in the image below.

Relational is on the upper left, where you put everything into a tabular, rigid structure.
There’s also analytical, where you have all the facts in the middle. This is good for aggregate reporting. But, as they say, aggregation is not knowledge.
And then we have the four NoSQL patterns: key-value stores, column-family, graph and document.
Although we’ve studied a lot of them, one of the most underutilized today in healthcare is graph, which is unfortunate because healthcare data generally fits beautifully and correctly into a graph structure.
What I’ve seen in the past is that many organizations are dominated by one technology. It might be relational, for example, which only brings a single perspective to the solution space.
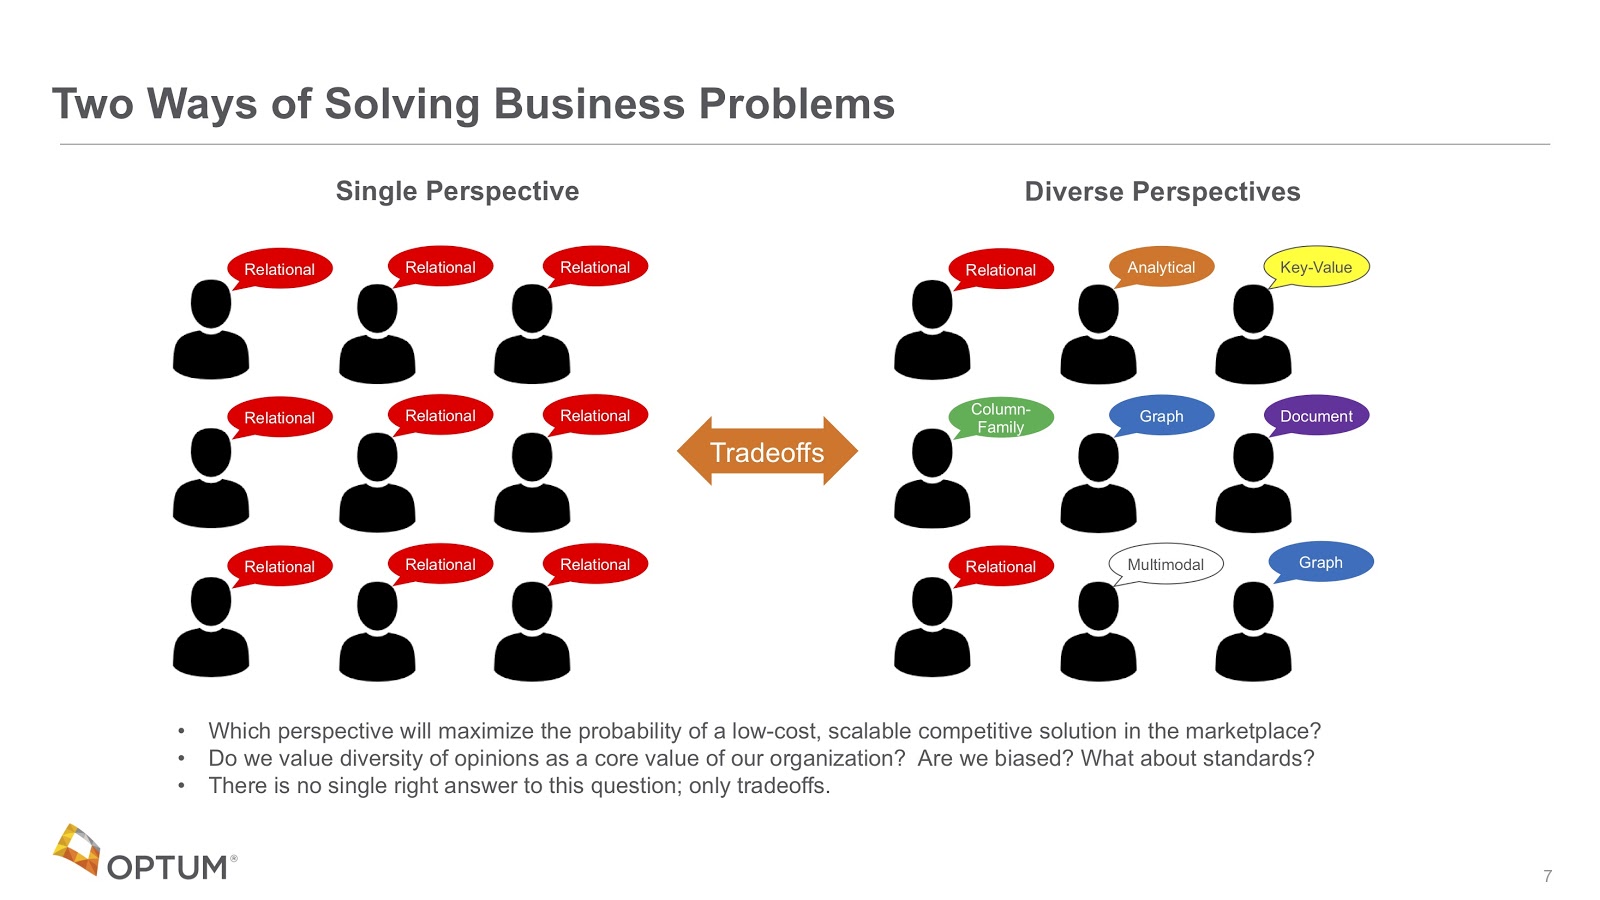
What we’re saying now is that in order to be competitive in a world that contains all of this healthcare data that’s changing so quickly, we need a diverse set of perspectives. It’s not just graphs, but it’s graphs in combination with other things, such as key-value stores, search engines and multi-model systems. This is what makes organizations in healthcare competitive.
Architectural Approaches
Let’s talk a little bit about that process then. In the top row in the image below, you can see all of the different ways in which we decide the requirements and quality attributes of a certain system.

What we’re seeing now is that the bottom row – that middle box with the architectural approaches – is what we want to fill in with these different solutions.

This was a process developed at Carnegie Mellon University, and it’s called the Architectural Tradeoff and Modeling Approach. It helps us rank various approaches, do the analysis of fitness and understand the tradeoffs.
From here, what we see is that certain approaches have critical requirements, like high availability or the ability to manage complex rules, which often fit very well into graph systems.
Challenges in Healthcare
Alright, let’s talk about the big problems in healthcare.
At Optum, we acquire many companies that do fully different things. For example, we might buy a company that does lab testing, another one that does MRIs and another that does ophthalmology exams. All of their data is completely different with high variability and many diverse formats.
Healthcare also contains a huge amount of complex terminology, such as the names of every drug, symptom and disease.
We are also trying to build more trust. This is something graphs aren’t designed to do, but if you study blockchain and blockchain technologies, you’ll see how we’re working on making healthcare organizations exchange data in a better, more trusting way.
We also have huge privacy issues. Everybody knows about healthcare privacy and the Health Insurance Portability and Accountability Act (HIPAA). So the way in which our systems hold protected health information (PHI) data has to be rigorously audited.
We also wanted to start to do things with chatbots. It would be wonderful if a patient were able to open a chatbot and ask: “Are flu shots covered by my health plan?”
The last two challenges are machine learning (ML) and explainability as well as scaling problems.
The Integration Challenge
Alright, so the first thing is the integration challenge.
Today, we often have different systems running in different companies, built at different times with different technologies. We think of all of these as silos; when people perform analytics, they’re usually only performing on one silo. It’s very difficult to merge data from multiple silos.

What we’d like to do is move to an area where everything is correctly connected into one large, healthcare knowledge graph. We call it entity resolution since we’re integrating everything. This includes the van driver that drops people off at nursing homes, complex clinical systems, electronic medical records, prescriptions, allergies to drugs, your entire genome and more. All of these things contribute data to your healthcare individual patient record.
Our vision is that all of this will eventually fit into one large connected graph. This is a long-term vision, but it’s the goal we’re trying to move towards.
Data Variability
Let’s talk about variability. Looking at the image below, we see that since every company has a general ledger but the structure of that general ledger is very consistent throughout, it has low variability.
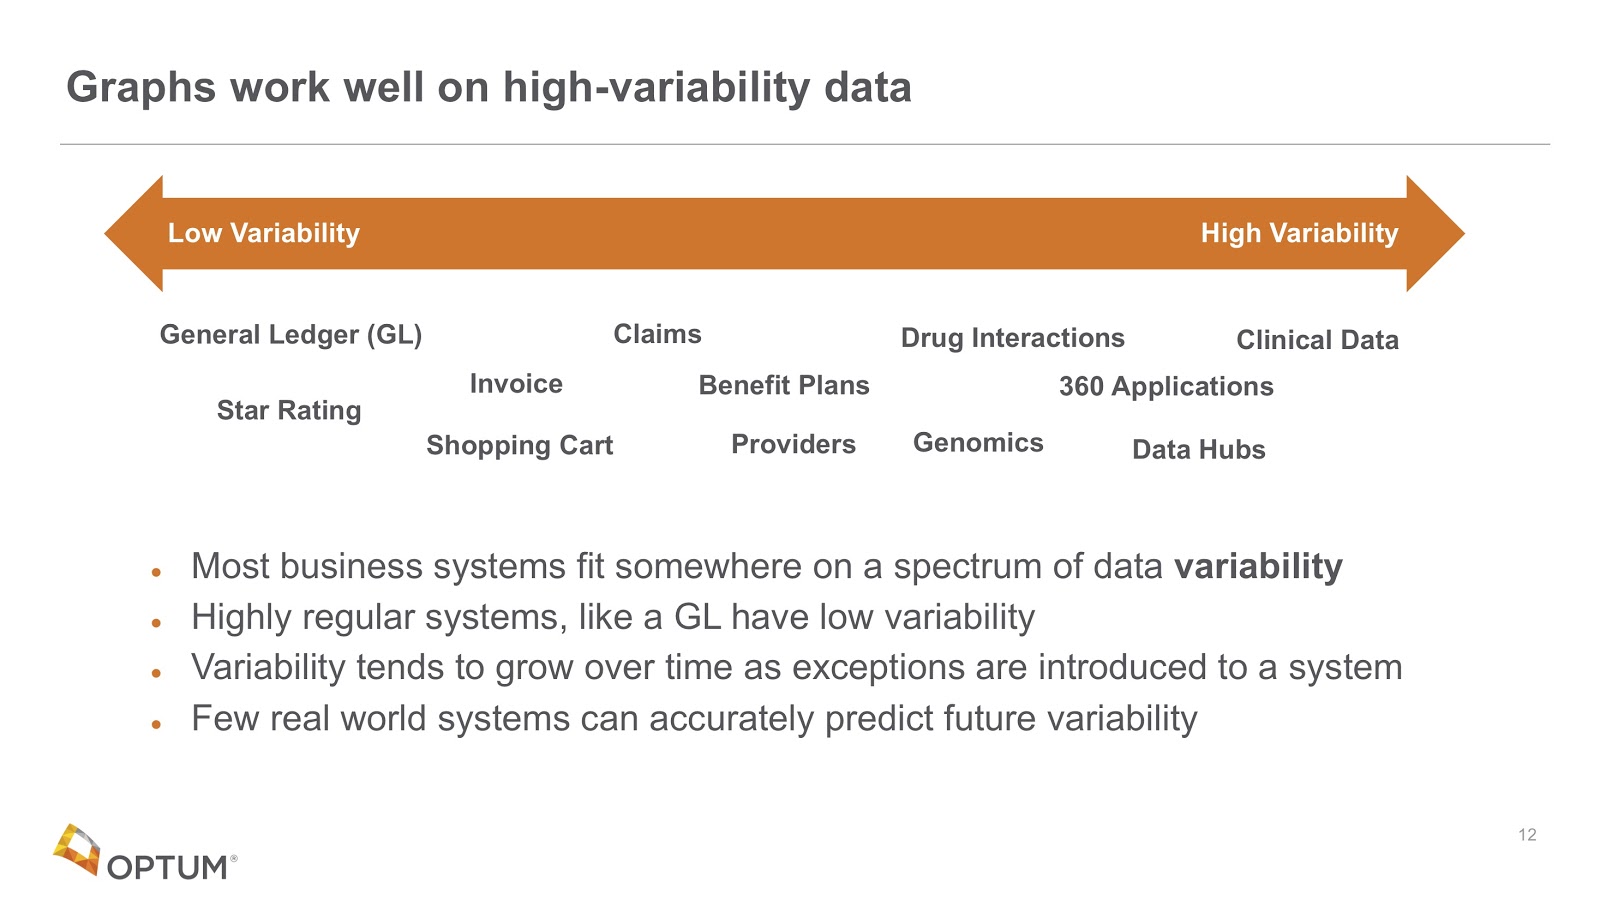
If you look on the other extreme side – the far-right – clinical data has very high variability.
We often ask organizations to tell us about the variability of their data and gauge what percentage of their records have exceptions. Sometimes even one percent of your records having certain things requires adding extra columns to those databases, and those tables can get very wide and inefficient.
Moreover, very few people can predict future variability.
Chatbots
On top of that, we’re in the process of building chatbots.
For example, a patient might want to open a chat in their healthcare system to ask about their coverage since they’re expecting a new baby. In this scenario, we need to have a chatbot who knows the association between “new baby” and “maternity coverage.” This involves taking alternate words and labels and linking them together.
So how do we do this? By creating graphs.
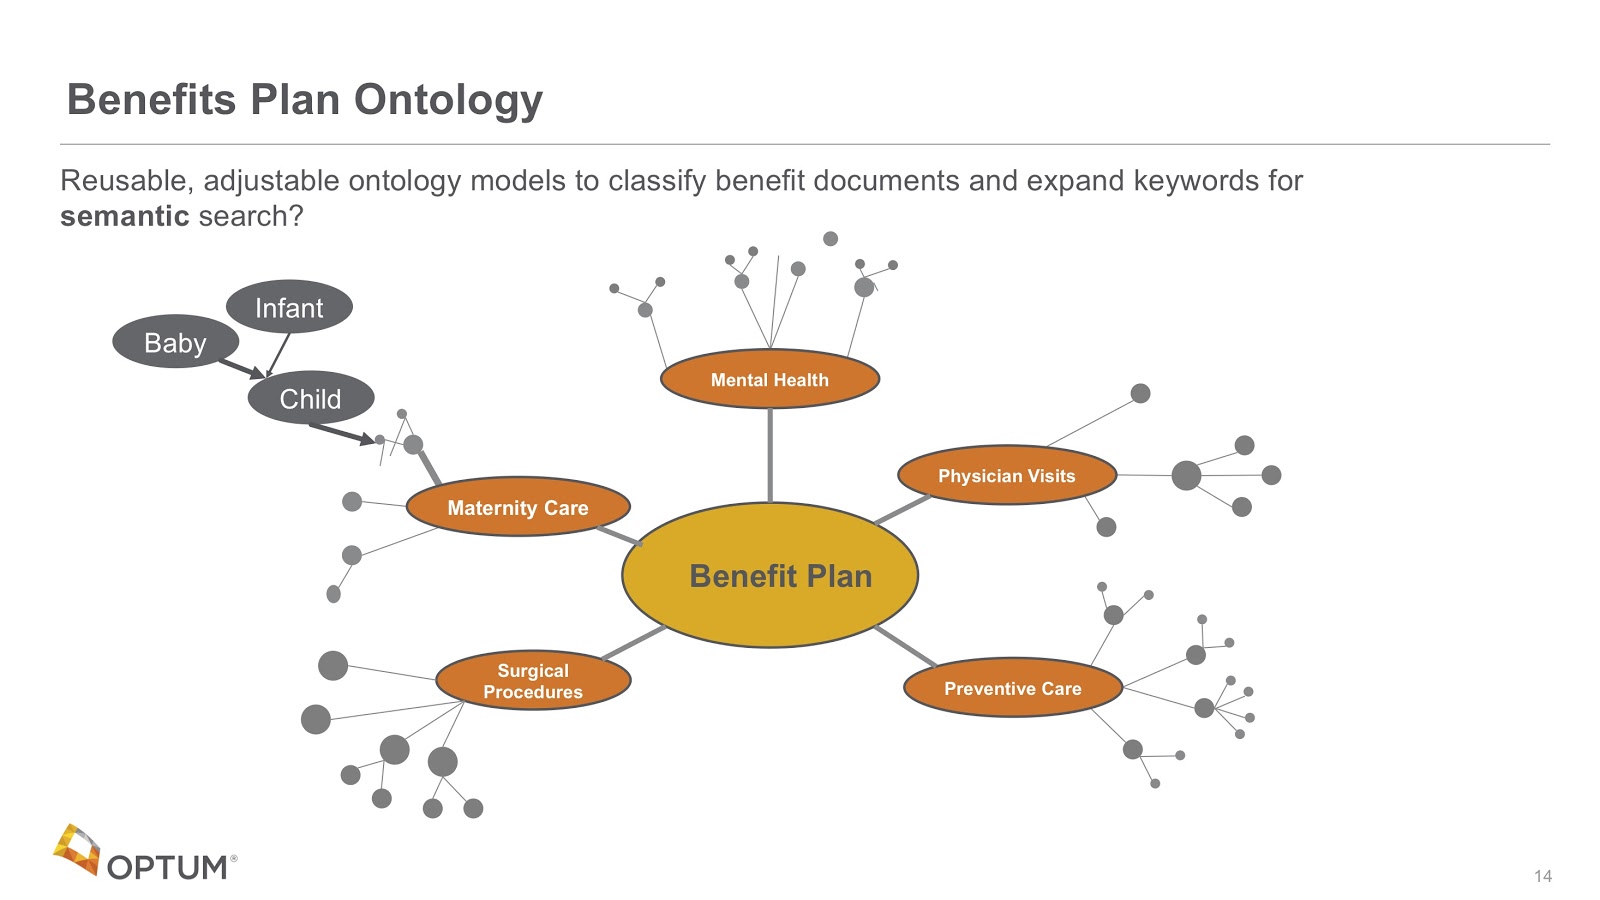
In the example above, we’ve built taxonomies for all of our benefit plans. Every time chats and questions come in, it adds to those taxonomies. We use these taxonomies for two purposes.
The first purpose is for every time a new benefit plan is published, where we can look at the words in it and associate them with the right parts of that taxonomy. We call this the document classification problem.
The second purpose is for when we look at patterns in these graphs. For example, we can identify that as we go from baby, we can walk the tree and indicate how that’s closely related to the maternity care tree.
These are the standard ways in which we’re starting to use graphs to help us with our search. More chats that are answered means fewer calls for our call centers. This is significant because it typically costs companies $10 to pick up the phone and answer questions like this.
However, we can’t do this easily today because everybody’s benefit plans, deductibles and copays are different. In this way, we need to look up to very dynamic databases.
The Value of Connected Data
The question we’re starting to ask is: what’s the value of connected data?
We had a group come to us a while ago saying they had these new genetic tests that they’d never had before, and they’re getting cheaper and cheaper. And they also had these ICD9 diagnostic codes that were associated with medical records. They wanted to know what genetic tests they should be recommending to figure out what genes were associated with these diagnostic codes.
The challenge we faced is that we had some of these connections, but not all of them. What we’re seeing is that we want to add other ontologies that help us map these things together.

We find a lot of these ontologies out in the open link data connections. There’s a system called the Unified Medical Language System that has a database of ICD9 codes that are connected to concepts. By putting these in a graph, we can perform the graph traversals and now recommend what genetic tests are associated with the right ICD9 codes.
What we’re trying to do is build this connected healthcare network graph that has all these different objects that we see in the healthcare system.
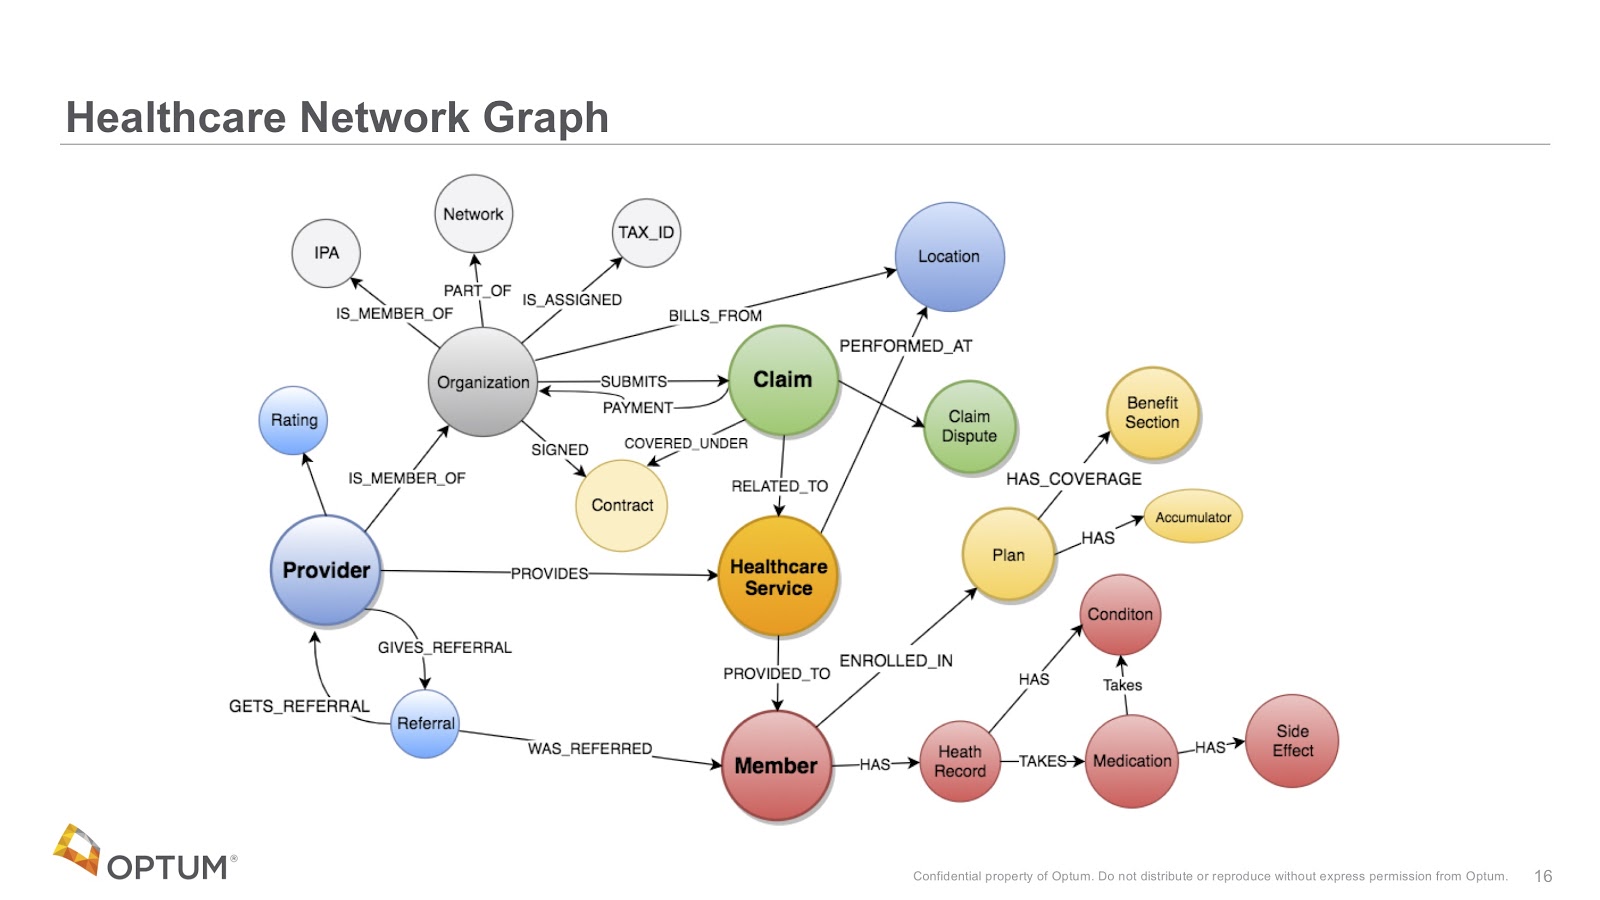
The image above are notes we had from a typical whiteboard session with one of our groups who was very interested in providers, the referrals of those providers and stuff like that.
Often, we put this same information chart into a document and meet with another group, who would say that’s exactly what they wanted, but they’re also interested in net promoter scores for providers, for example. In this way, the chart keeps growing and growing, and we therefore need to add all of this information into a single graph.
We’ve never had so much information tied together, simply because if we did this in a relational model, it would be too complicated. Our hope now is that by putting things in a graph, we make connections that have never been made in the past.
So what are we moving towards? We’re moving towards trying to store individual healthcare records in individual knowledge graphs and then connecting them.

Now, if you have a diagnosis that has an ICD9 code, we might store that code in an individual graph, but it’ll point to a very large graph that has all the knowledge about healthcare.
We’re anticipating that there will be a rich set of pointers between records and this universal knowledge. Queries need to be able to access both of those. But we also need to be able to lock down an individual patient at a certain hospital, so that if you’re doing a query on them you may not be able to see the others.
There are some cases though where you’re doing high-level statistics across multiple patient pools, so we need very robust, role-based access control over all of our patient records and still allow them to be linked into this universal knowledge.
Graphs Promote Cross-Domain Solutions
What we’re really doing here is promoting new ways of looking at data.
In the past, our Optum employees thought the relational database model was fixed and unchangeable. Though adding a new column is possible, if we have 10,000 reports then we would have to change the SQL for all 10,000 of them. This would cost us half a million dollars.
Now we’re telling people not to worry about that – that anyone should be able to add data. We should all be able to harvest data from our call logs, add those things together and leverage public data sets.
For example, one of our call centers sees a lot of people in Medicare and retirement, and most of them don’t drive. They wanted to recommend them with providers that are near a bus route.
Sure enough, we can get access to public data about bus routes and rank every one of our providers based on how close they are to a bus route. We could add bus route data in a way quickly – in a matter of days – which in a relational database would have been a year-long project and cost multiple millions of dollars.
The agility of being able to add new data sets at any time and cross-link them has helped us provide better value faster.
Explainable AI Models
Let’s say you’re in a clinic with this big knowledge graph. You run some machine learning on that graph and it recommends you do some diagnostic tests for diabetes. In turn, the doctor might ask why it recommended that and why it’s trustworthy.
That’s what we’re dealing with today when we use this traditional deep learning model. Rather, we want to work toward a new architecture where instead of just having it function, the machine learning process will update what we call learned explainable models.

These models are graphs that are updated as we perform more machine learning. In turn, this allows our physicians or members to actually ask questions through an interface that looks much like Bloom. Why did you recommend this? Explain it, and show the traces of the weights of why this is important. Give some metrics. How would one give feedback into the system?
These are some of the questions explainable artificial intelligence (AI) models might be able to answer that would promote trust.
Therefore, we cannot use deep learning algorithms that do not have explanations in the healthcare system. Instead, we believe using graph models is a much better way to build explainable AI.
Model-Based Machine Learning
Another thing to look at is model-based machine learning.
If you study machine learning today, you generally take a lot of variables, flatten them and put them into your features – typically in a tabular function. You have all these complicated algorithms that you have to use to unwind that flattening.
What we’re moving towards is the idea of a single graph that encodes the assumptions we make about that data. We’re finding that by using this idea, there will be fewer algorithms that we need and those algorithms will be much easier to understand.

This is all called model-based machine learning, where graphs are an intimate part of the learning process.
Three Useful Metaphors
To wrap up, we’ll introduce some metaphors we’ve been using to explain all of this to management. In fact, some of these metaphors are actually being used in a few of Neo4j’s training classes now.
There are three main metaphors we’ve been using to help understand the way in which graphs are different: the neighborhood walk, the open world assumption and the knowledge triangle.
The Neighborhood Walk
Let’s say you wanted to go over to your neighbor’s house. How would you do this? Naturally, you’d open the front door, walk out, point to their house and walk there.
It’s very simple, direct and represents a metaphor of how we store relationships – by storing permanent pointers in a graph database. It’s also adjacent to anything in the real world that has relationships, which we store as hard-wired pointers that are one hop away. In other words, you don’t need to consult anything else to get to your neighbor’s house.
So how would we model this? We’d model that as a graph. For example, in the code below, Dan lives next to Ann. And so we see a very nice relationship in the physical world as something we can draw on the whiteboard.

Let’s contrast this with the way relationships are calculated in relational databases, which do not store permanent pointers in memory. In actuality, when you do adjoin, the “where” clause is actually a search. That search has to go into a central system to complete the search.
The picture here is that you can’t walk over to your neighbor’s house directly. Instead, you need to walk downtown to index town.

So what’s index town? Well, it’s a huge bureaucratic building where you stand in a line – like at the DMV – that takes a long, long time.
When you finally get to the front of the line, you tell them you want to go to 123 Main Street. They’re going to plug that address into the computer and do a binary search. The more data there is, the slower that search is. It’s also hard to predict its performance because they don’t know how much data they’re going to have. Finally, they find that record, give you the GPS coordinates, you plug those coordinates into your phone and then you can walk over to your neighbor’s house.
It sounds like a silly story – and it’s designed to be silly, particularly because we want you to remember it. In fact, we’ve tested this. Two weeks later, if you come up to someone and ask whether they can explain the difference between graph and relational databases, if they remember this story, they’ll try to express it.
They might have to go back and look at their notes, but this is a story that works. You can test this, send out a survey two weeks after you do this in training, and ask how many people can explain it.
If you think of one thing that makes a graph unique, it’s understanding index-free adjacency – but nobody remembers that term. However, they will remember this metaphor, so try to use it to explain it, especially if you have managers who want to understand it but don’t have the time and energy to remember complex technical terms.
The Open World Scenario
The second story we use is called the open world scenario, or open world assumption. We borrow this term from the world of semantics and descriptive logics.
In the relational world, we have something called the closed world. It’s closed in the sense that everything is prohibited from storing in the database unless you model it. In other words, unless you create rules for it, everything is prohibited until you create a permission rule. You can only add data that you model, and adding that data might impact all of your future queries. This is very tedious.
The good world is the open world, where everything is permitted in the database unless we put in a specific rule that prohibits that data from being used.
An important difference between relational and graph databases is that when we create new vertices of a certain type in graph databases, we also put types on the relationships between them, so our queries also use those relationships. They don’t use wild cards.
In general, in the open world scenario, everything is permitted unless there’s a rule. If we write our queries correctly, we can add new data without disrupting our existing reports, which makes all the difference in the world. All of this makes our graphs more modular, more open and more easy to build and test. The open world is what gives us agility.
The Knowledge Triangle
The third one is the knowledge triangle. The knowledge triangle – shown below – is pretty similar to what we’ve seen in other cases, where we have low-level binary data at the bottom, which includes numeric codes from the systems, lookup tables and pick lists.
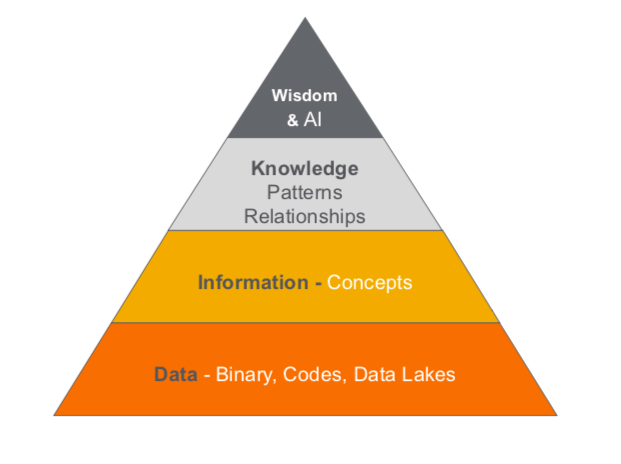
Source: Wikipedia.
On top of that, we have concepts: the nouns in our world. Then we have knowledge, which includes pattern and relationships at the graph level.
Finally, on top of that, we have wisdom and AI, which asks whether we can structure our knowledge in a way that’s reusable across projects.
We’ve spent a lot of money building data lakes in companies. Data lakes were useful mechanisms for taking data out of our transactional systems and putting it in one place so we can query it over and over in a way that won’t constantly disrupt our transactional systems. It took the burden off of our slower relational databases and stored it in a cheap way.

But many organizations were sold a bill of goods about data lakes. They thought they would be databases in themselves, but when we put all those numeric codes together, we didn’t have the tools to decode them.
Now we’re saying that we need a whole new generation of tools, including AI, machine learning and complex rules engines. We’re actually using graph technology to extract data from our data lakes and putting them into disconnect nouns, but also verifying them and making them consistent.
From there, we want to pull together and find new relationships. This is the entity resolution camp. There’s some fantastic tools out there that are starting to get really good at energy resolution. You can start to look at this data and make those connections.
The last step is shown at the very top of the image below. If you Google the concept of transfer learning, you’ll see how we’re going to learn and capture things in our AI models. We’re putting them in a spot where they can be reused so we don’t have to do so much training. Then, on top of a base or image model, we’re going to add models for specific types of images as well as customizations.
In healthcare, we have a whole set of referenced data regarding terminology. We’re working very hard to make sure we can represent all healthcare terminology in a uniform graph structure for all of our applications to use.
It’s an ambitious goal, but it’s really important right now because we have hundreds of people within the organizations that we purchased that have already duplicated this data – and it’s our job to try to bring all of that data together.
The Apocryphal Cancer Gene Story
So what’s at stake here? If you’ve read The Book of Why by Dana Mackenzie and Judea Pearl, which is a fantastic story about causality, you’ll understand how by building causal graphs, we can make a much deeper understanding of our data.

The story on the left is this apocryphal story called The Smoking Gene. It was promoted by a lot of tobacco companies, who stated: “There’s probably some gene inside of you that causes you to want to smoke. It’s a coincidence that you also get lung cancer, but there’s probably no direct relation between your urge to smoke and lung cancer. Lung cancer just happens because it’s caused by the same root cause: the smoking gene.”
What we discovered – unfortunately almost 20 years later – is that we can understand the causality between smoking and tar in the lungs as well as the causality between tar and lung cancer. This is the graph shown on the right.
We see this same thing over and over in scenarios where people are trying to get healthcare coverage that might not be effective. What are the benefits of vitamins? What are the benefits of homeopathy and acupuncture?
Our job as data scientists is to figure out which ones are the most cost-effective and which ones have good outcomes. We want to take real-world evidence from our claims and understand the effectiveness of certain drugs in the context of the people taking them.
Moreover, many drug studies have only been done on 50-year-old males. Now, we want to know about younger females. All of these things have different causality and we have lots of data, but we need to store them in graphs and make sense of that data. In this way, data scientists really need to understand causality to do this.
Combining Graphs with Other Technology
A lot of interns at Optums naturally gravitate toward graphs. Many of them actually got certified in Neo4j and look at graphs as a fundamental way to think and how to solve problems.
We believe that graphs are going to be the foundation for helping us lower the cost of healthcare. But it’s not just graphs alone. We need people who fundamentally know graphs and are able to layer other technologies on top of that.
We call this phenomenon the wicked problem in healthcare, where we have lots of disconnected data that we want to put together and lower the cost of healthcare. And we’ve already seen lots of this: graphs and natural language processing (NLP), graphs and ML, graphs and search, graphs and semantics, visualization, distributed systems, security, statistics and causality, among other technology.
In this way, it’s not just graphs alone that are doing this, but also the technology used in tandem with our graphs.
Read this white paper The Power of Graph-Based Search, and learn to leverage graph database technology for more insight and relevant database queries.
Share Article


Explore
Related Articles

Find Similar Patient Journeys With Neo4j Aura Graph Analytics