Check Out Some of This Year’s Graphs4Good GraphHack Projects

Neo4j Program Manager, Community Development & Enablement
6 min read

Hope everyone had a happy Global Graph Celebration Day!
For the second year in a row, the Neo4j community collaborated to share graph thinking with the world on April 15th, the birthday of Swiss Mathematician and inventor of Graph Theory, Leonhard Euler.
This year, however, has been a much different experience for the “coming together” of graph-enthusiasts everywhere.
Although this pandemic resulted in the closing of borders and stay-at-home quarantines, it has united us in a way we’d never thought imaginable. For the first time ever, no matter where you are in the world, we can more closely relate to the current experiences of one another. Languages, cultures, geographic regions, etc. aside, we’re all very much experiencing a wave of similar emotions as we push our way through this. It’s not just about you and me, it’s about a collective effort, everyone needs to pitch in.
If anything we should take away from this is that we’re better together. If we are kind and help one another, we can do almost anything.
With this in mind, I’d like to recognize all the Graph Hackers who participated in this year’s Graphs4Good GraphHack. From the western most region of the United States (San Diego, California) to all the way “down under” (Syndey, Australia), hackers took initiative, got involved, shared, helped and advised – all for the good of others.
View the Graphs4Good GraphHack kick-off video:
Here’s a smattering of this year’s GraphHack projects:
Exposure Tracker: Crowdsourced Contact Tracking for Good
Project Lead(s): Stephanie Hedger, Damian Noonan and Kim Spithill
Currently, we have very few tools to stop the spread of COVID-19. One that we do have is social distancing. If we could completely stop all interactions between people, this would be over very quickly. Unfortunately, to keep a country operational, we have people that still need to be moving around. Some of these people may be asymptomatic carriers or they may encounter someone who is. Anyone of us going to the grocery store, the doctors, to work may contribute to the virus’s transmission without even knowing it. To combat this, health officials need to trace the movements of anyone that tests positive, then all the people they encountered, and all the people encountered, and so on. This is difficult and time consuming. To assist with this, we have designed a crowdsourced contact tracing app. The front end is a simple app that reports observations of the phone’s movements. Using GraphQL these observations are written to a SQL data-store before being processed into Neo4j for analysis using the POLE principles. Using Neo4j, we can quickly and efficiently identify and notify users who have encountered a hotspot. This can also be shared with health officials to identify and map areas of concern.
Links: Website | Kick-Off Presentation | Github | Neo4j Community Site Thread
Project Domino: Scaling COVID-19 Behavior Change and Anti-Misinformation
Project Lead(s): Leo Meyerovich, Sean Griffin (+ many others: Stanford, IU)
We built a real-time at-scale knowledge graph of COVID-19 Twitter and are using it to feed analytics and interventions around COVID-19 behavior change and anti-misinformation. Our warmup started by ingesting 100 Tweets/s to see how 10M+ accounts discuss COVID-19, such as by sharing 2M+ URLs. We are using the database and related data sources to power tasks such as flagging scams, track clinical disinformation, and hopefully soon, help policy modelers and leaders understand behavior compliance and non-compliance across demographics and regions.
Links: Kick-Off Presentation | Github
COVID-19-Community: Community Effort to Build a Knowledge Graph to Fight COVID-19
Project Lead(s): Peter Rose and Ilya Zaslavsky
Project Covid-19-Community crowdsources a knowledge graph that links heterogeneous data about COVID-19.
Links: Kick-Off Presentation | Github | Neo4j Community Site Thread
Epidemic Simulator: Live Visualization of an Epidemic Through a Simulated Population
Project Lead(s) Robert Allison, Weidong Yang, David Hughes and Sachin Deshpande
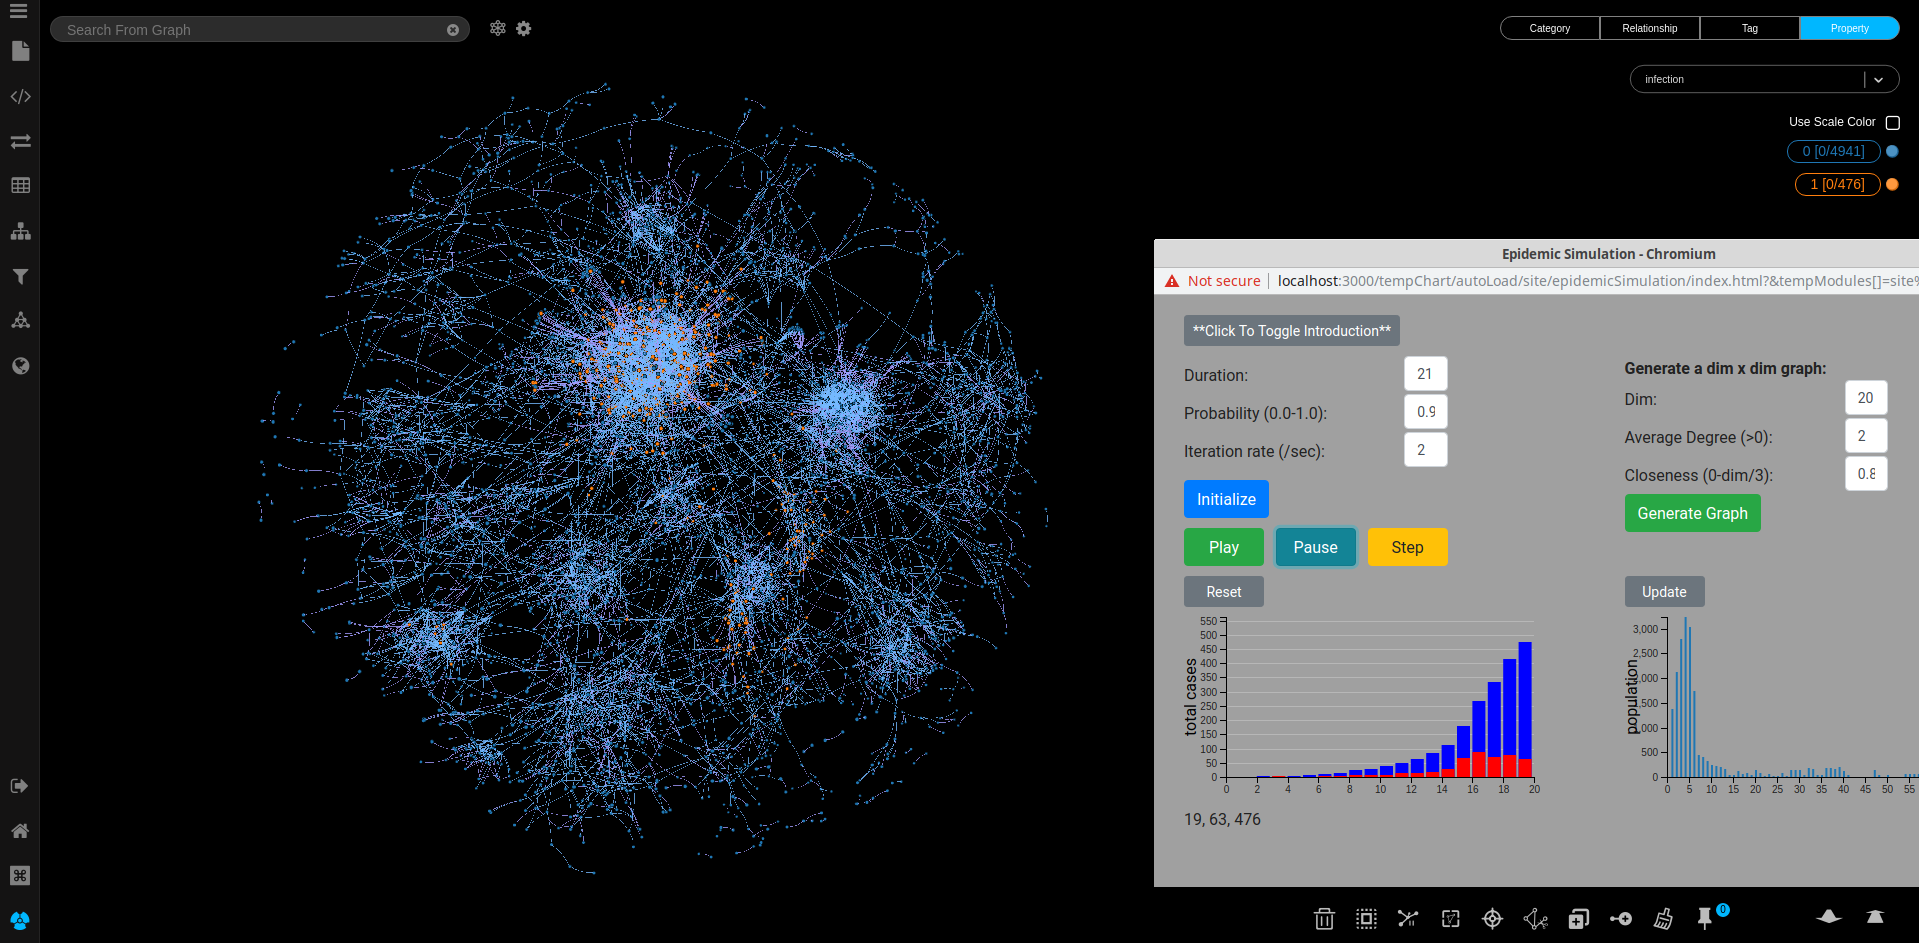
We wanted to model an epidemic spreading through the social connections of a representative population, and gain statistical insights from that. We have used GraphXR backed by Neo4j, with a custom coded simulation extension that has allowed us to programmatically update the graph while it is being visualized.
Links: Website | Kick-Off Presentation | Neo4j Community Thread | Github | Blog
COVID-19 Check: Tracking Close Contact Between Individuals Within 14 Days
Project Lead(s) Thang Tran – lead, Phong Do, Kyle, Nam Dao, Ken Nguyen, Hiep Nguyen, Huy Pham and Will
The main objective of COVID-19 Check is to build a large-scale graph database to archive contact points between individuals within 14 days (14 days is the common incubation period of Coronavirus, after 14 days, the contacts are meaningless).
This graph database is built based on the combination of different data sources:
- User-provided data
- Official epidemiological data from the Coronavirus Anti-Epidemic Steering Committee
- Social media data from participating partners
After the network has been established within 14 days, if there are any changes on the network, the calculation for the related nodes will be done immediately. Here are some specific examples:
- When an individual (node) is confirmed to be infected with Coronavirus (F0), F1, F2, F3, etc will be immediately found
- When a flight is confirmed to have passengers infected with Coronavirus (F0), all passengers on that flight (F1) and their contacts (F2), etc. are also found promptly
- When a place is confirmed to have people infected with Coronavirus (F0), all people who arrive at the same time with the infected patient are immediately found
COVID-19 Check is built based on Neo4j, NodeJs and ReactJS.
Links: Kick-Off Presentation | Github | Blog
Knowledge Graph to the Rescue: COVID-19
Project Lead(s): Siraj Munir
Knowledge graph with keyword-based semantic query engine.
Links: Kick-Off Presentation | Blog | Github | Neo4j Community Site Thread
Awesome COVID-19: Collection of Tech Resources and Initiatives Around COVID19
Project Lead(s) Alessandro Negro and Christophe Willemsen
Links: Kick-Off Presentation | Github
COVID Graph: Knowledge Graph on COVID-19 that Integrates Public Datasets, Patents and Entities from Biomedicine
Project Lead(s) Martin Preusse and Dr. Alexander Jarasch
Links: Website | Kick-Off Presentation | Github
Knowledge Graphs for Social Good: Constructing Graphs with Open Datasets to Measure Progress Towards the UN Sustainable Development Goals (SDG’s)
Project Lead(s) Lambert Hogenhout (United Nations), Vivek K Khetan (Accenture), Colin Puri (Accenture), Thomas Deely (Co-Founder, Knowledge Graph Conference)
This will help Governments, the UN, Corporate and NGO efforts to address the SDG’s.
Links: Website | Kick-Off Presentation
PandemicRT Data Project: Medical Supply Database Combined with Data Platform that Forecasts Needs for Resources Around the Country
Project Lead(s) Jon Gosier and Douglas Berman
Links: Kick-Off Presentation | Github
Covid19_provenance_n: Social Provenance and Graph Spread Using Neo4j & PROV
Project Lead(s) Guillermo Fernandez (Sys. Engineer & Sociologist, History PhD)
Links: Kick-Off Presentation | Github
Aspen: Markup Language for Turning Text into Graph Data
Project Lead: Matt Cloyd
Aspen is a markup language for turning text into graph data (via Cypher for Neo4j). We’re building a way for less-technical folks to produce graph data from text notes. Feel free to get in touch if you think this might be useful for your Graphs4Good project.
Links: Website | Kick-Off Presentation | Github
Covid19 GraphQL: Building GraphQL Schema for Open Source Projects that are Developing API or Databases for Covid19 Data
Project Lead: Michael Graham
Links: Kick-Off Presentation | Github | Neo4j Community Thread
Syria Violence Detection: Using Neo4j Algorithms to Aggregate Data Sources for Attacks in Syria
Project Lead: Nick Hall
Links: Kick-Off Presentation | Github | Neo4j Community Thread
Neo4Stock: Easy Sharing Stock Management Between Entities
Project Lead: DELAUNAY Jérome
This is an efficient way to share stock management between entities (medical or not) or more simply medical resources sharing, availability announcement and second-hand product proposal.
Links: Github
Question-Answering Graphs: Gain Insights from Q&A Systems Like StackExchange
Project Lead: Doulkifli BOUKRAA Ph.D.
Applying Neo4j graph algorithms (or the GDS library) to gain insights from question/answering systems such as StackExchange (SE).
Links: Kick-Off Presentation | Github | Neo4j Community Thread
Show off your graph database skills to the community and employers with the official Neo4j Certification. Click below to get started and you could be done in less than an hour.


