Elevate Fraud Detection With Neo4j on AWS: Uncover Hidden Patterns and Enhance Accuracy


4 min read

Discover how Neo4j’s graph technology integrates with AWS to tackle fraud with advanced pattern recognition, reducing false positives and transforming financial security.
In the ever-evolving area of covering fraud false positives and negatives, we recently published Neo4j AWS architecture which sheds light on how graphs help amplify coverage to current fraud detection systems in tackling false positives/negatives.
This blog covers what are current challenges, how graphs provide enhanced coverage over and above traditional methods and what this architecture would look like on AWS.
The Challenge: Transforming to Modern Tech and AI
Financial institutions—banks, insurance companies, and other service providers—encounter substantial hurdles in identifying and thwarting fraud. Their current fraud detection systems suffer from a high false positive rate, relying on traditional rule-based approaches and relational technologies. Unfortunately, these methods struggle to keep pace with fraudsters who constantly evolve their tactics and use advanced approaches.
Moreover, regulatory requirements are ever-changing and increasingly intricate. In response, there’s a pressing need to enhance existing systems by leveraging data interconnectedness. Graph technology excels in this regard, effortlessly revealing hidden patterns within the data.
Detect Fraud: Uncover Hidden Patterns in Your Data
Detecting fraud goes beyond individual data points to the connections that link them. That’s where Neo4j’s fraud detection capabilities shine to uncover and investigate complex fraud.
Graph-based use cases for fraud detection and prevention include:
Entity resolution: In large datasets, the same entity may appear with variations in names, addresses, or other attributes. A graph helps reconcile these variations by leveraging Neo4j Graph Data Science algorithms and creating a unified view of the entity by linking related records (e.g., accounts, transactions, or individuals).
Layered transactions: Fraudsters use layered transactions to create layers (multiple accounts, assets, or instruments), making it complicated for authorities to trace the money back to its illegal source. Graph pattern matching helps track down entire complex and deep money trails using its native graph implementation.
Circular money flow: Fraudsters engage in a coordinated buying and selling process, often using multiple accounts. This leads to artificially inflated volumes and an appearance of liquidity. Graph Data Science clustering algorithms help detect communities based on highly interconnected data (trades, volumes, accounts, etc.).
Network analysis: Financial institutions use network analysis to uncover hidden patterns and connections within transaction data. By analyzing the topology of transaction networks, they can identify unusual behaviors, detect anomalies, and reveal relationships indicative of fraudulent activities. Graph Data Science clustering algorithm helps with entity link analysis (detects suspicious patterns), path-finding algorithms help identify circular flows of funds or repeated patterns.
Fraud ring: A fraud ring consists of multiple sophisticated fraudsters working together. These groups operate methodically, share information, and collaborate on fraudulent practices. Graph pattern matching and data science clustering algorithms help strongly connected groups engage in known fraudulent activities.

Extract a Higher Level of Knowledge
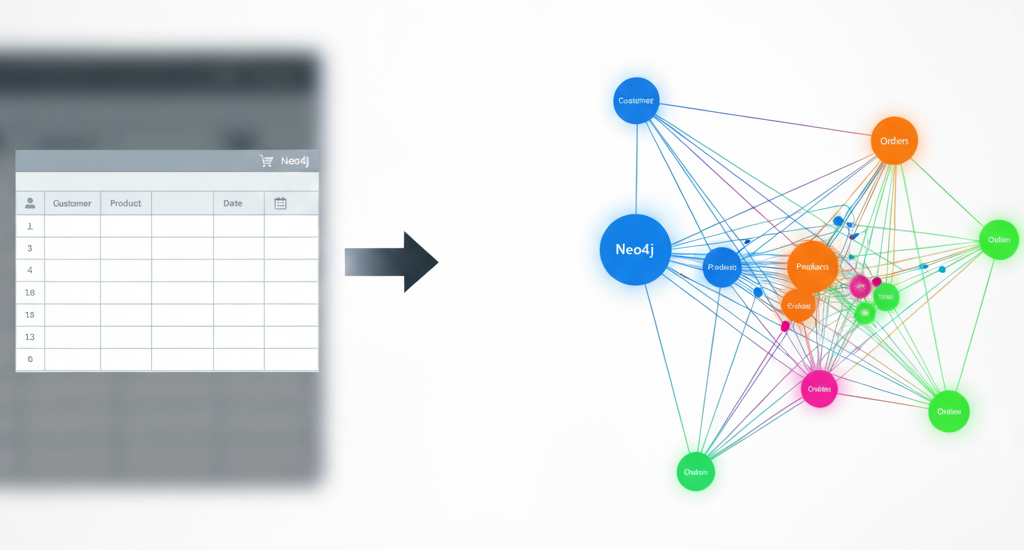
Building a knowledge graph allows us to design data models that naturally mirror real-world relationships and business logic. The idea of a knowledge graph is to incrementally add data (new entities and relationships) and extract a much higher level of knowledge — think exponentially higher — or patterns from this updated graph. This cycle can keep repeating and improving your results.
Below is a simplified graph representation of the financial dataset. It highlights how well the data can be modeled and its contextual complexity.

The graph instance below represents real-world data points, entities, and their relationships.

Effective Data Loading
Effective data loading into a Neo4j Graph Database is essential for optimal performance and efficient querying. A well-designed graph data model that accurately captures domain relationships is crucial. Neo4j provides tools for importing data in various ways, including bulk, batch, and continuous loading.
Here are some key techniques:
Base nodes first: Create base nodes (e.g., location, email, products). These serve as anchors for connecting other common entities (e.g., customers, accounts) during data loading. Later, advanced entity resolution techniques can be applied.
Keep it simple: Neo4j’s schema-less nature allows you to start with minimal complexity. Load metadata properties (e.g., customer ID, type, and email) to capture interconnected data. Prioritize essential information over intricate details.
Efficient initialization: Choose between bulk and continuous loading based on your needs. Bulk import handles large volumes quickly, while continuous loading ensures near real-time data integration and analytics.
Pattern Matching
Graph pattern matching is a powerful tool for querying and analyzing graph data efficiently. It allows you to express complex relationships and uncover meaningful insights.
The following Neo4j Cypher query language pattern statement matches the layered concentration of funds, using how multiple customers perform small chunk withdrawals and deposits into a single account through multiple layers:
MATCH path =
(customerA:AccountHolder)-[:HAS_ACCOUNT]->(customerADepositAccount:DepositAccount)
-[:WITHDRAWALS]->(transactionA)-[:DEBITS]->(acctB) -[:CREDITS]->(transactionB)-[:DEPOSITS]->
(customerBDepositAccount:DepositAccount)<-[:HAS_ACCOUNT]-(customerB:AccountHolder)
RETURN p
This query result can be visualized in Neo4j Bloom for easier interpretation with explainability.

Hidden Patterns
Neo4j Graph Data Science equips data scientists with powerful algorithms to analyze graph data efficiently, uncover hidden patterns, and make informed decisions. These algorithms, from centrality to node embedding, help execute graph-native unsupervised and supervised ML for clustering, similarity, classification, and more.
The following is in the context of a contract fraud use case. It shows a community of agencies participating in a government contract bidding process. The orange relationship represents the awarded contract, and the gray relationship represents participation. This clustering using the Graph Data Science Weakly Connected Components algorithm helps identify why only a single company wins most of the time, whereas others might be there to show fake competition. This could be a case for further investigation.

Feature Engineering
Graph feature engineering is the process of creating new, meaningful features from graph data. It involves transforming raw graph data into a more effective set of inputs for ML models.
In the context of auto insurance claims fraud, below, we see a suspicious cluster (people sharing emails/phones/ identifiers). A person with high betweenness centrality (large yellow) is more likely to be a mule.

The above graph visualization helps identify areas of interest and potential predictors. This structural information can be used for feature engineering and transformed into a tabular format. ML models can then use this data to predict whether an individual is likely to be a fraudster. The resulting table includes client samples, their betweenness centrality scores, the count of shared identifiers, a weighted score based on shared information, and the ultimate fraud prediction.

In the table, we observe that William Roach shares an email address with several apparent family members, which is not particularly suspicious. However, Kaylee Roach stands out due to her extensive connections and multiple shared elements, leading the model to predict that she might be a fraudster. On the other hand, Elizabeth Drake raises a significant red flag by sharing a social security number with Kaylee, making her a likely candidate for fraud.
Data Visualization
Neo4j Bloom allows us to investigate and explore data that drive meaningful outcomes within your organization. You can explore data how you think and visualize, save exploration time, and share, explain, and make decisions quickly.
Fortify an Existing Fraud Detection System
AWS customers in the AWS ecosystem and using it to detect fraud can amplify the system using the above Neo4j graph techniques and the recently published Neo4j AWS architecture.

This enhances fraud detection system coverage by extracting hidden insights using graph algorithms and exporting graph features to enhance existing ML models on Amazon SageMaker to cover more scenarios. Predictive results can be further enhanced by graph pattern matching to add weights and explainability. Bloom visualization allows faster decision-making in investigative apps.
Where Do I Start?

Starting with a graph database for financial fraud prevention is an excellent choice. Let’s walk through the steps to get you started:
- Identify a business scenario where you see the problem needs interconnected context.
- Identify the data source(s) for your business scenario.
- Start modeling your data into a graph model.
- Create a Neo4j Aura database.
- Start ingesting your data into Neo4j AuraDB using Neo4j Enterprise Edition on AWS.
- Explore your data in Neo4j AuraDB using Cypher script, Bloom visualization, and Graph Data Science algorithms.
We also have a Professional Services organization that can help you implement. Reach out to them at sales@neo4j.com.
Take a Deeper Dive Into Fraud Detection
Check out Exploring Fraud Detection With Neo4j & Graph Data Science by Zach Blumenfeld. To learn how to build more accurate, sophisticated fraud detection applications with graph databases, get the free ebook Accelerate Fraud Detection with Graph Databases. Then, dig into knowledge graphs by reading What Is a Knowledge Graph?
Share Article


Explore
Related Articles
How a $28 Part Can Bring Down a $5M Machine — and How GenAI Stops It


Reinventing Retail: How Neo4j, Oneture, and AWS Can Power Multi-Agent Store Advisers