This Week in Neo4j – Visualizing BloodHound Data with PowerBI, College Admissions Scandal Visualized, New Release of Structr

Developer Relations Engineer
3 min read

This week Robert Schäfer and Grzegorz Leonie show us how they use Neo4j and GraphQL to build Human Connection, and Andy Robbins visualised Bloodhound data using PowerBI.
We also have a detailed tutorial on monitoring Neo4j with Prometheus, a new release of Structr, and the college admissions scandal visualised.
Featured Community Members: Robert Schäfer and Grzegorz Leoniec
Our featured community members this week are Robert Schäfer and Grzegorz Leoniec.

Robert Schäfer and Grzegorz Leoniec – This Week’s Featured Community Member
Robert is a Javascript and Ruby developer who helps beginners to learn programming and journalists to develop prototypes for innovative media formats. He lives in Potsdam, Germany
Greg is a freelancing fullstack software engineer who works with Javascript, Node, Vue, React Native, PHP, UI/UX, and design. He lives in Hamburg, Germany.
Greg and Robert are working on Human Connection, a free and open-source social network for active citizenship. The goal of Human Connection is to create a non-profit social knowledge and action network to meet the challenges of our time together, to preserve human dignity, and to create a future worth living for all people and future generations.
Human Connection uses Neo4j and the GraphQL integration for Neo4j, neo4j-graphql.js, which Robert and Greg have contributed to. They recently recorded a Neo4j Online Meetup showing how they use Neo4j and GraphQL to power Human Connection.
You can find Robert online at @roschaeferDE and Greg at @WillKnowThat
Using Neo4j and GraphQL to build Human Connection
In this week’s Neo4j Online Meetup, Robert Schäfer and Grzegorz Leoniec showed us how they used GraphQL and Neo4j to build Human Connection.
Visualizing BloodHound Data with PowerBI

Andy Robbins has started a series of posts showing how to visualise BloodHound data using PowerBI. BloodHound is a tool for exploring Active Directory Domain Security and PowerBI is Microsoft’s business analytics service.
- In part 1, Andy shows how we can use BloodHound data, the Cypher query language, and PowerBI to create elegant data visualizations that will help reveal and communicate security-related insights about your Active Directory domains.
- In part 2 he shows us how to use the beta Neo4j connector for PowerBI to create charts that can be easily updated by simply hitting the “refresh” button in the PowerBI GUI.
College Admissions Scandal Visualized

Shawn Roberts analysed the 990 Forms published by the IRS for the Key Worldwide Foundation and visualized the relationships in the data using Neo4j Bloom to help tell the story of the college admissions scandal.
Monitoring Neo4j with Prometheus, Applying Graph Analytics to Game of Thrones, Emil Interview on Open Source Underdogs

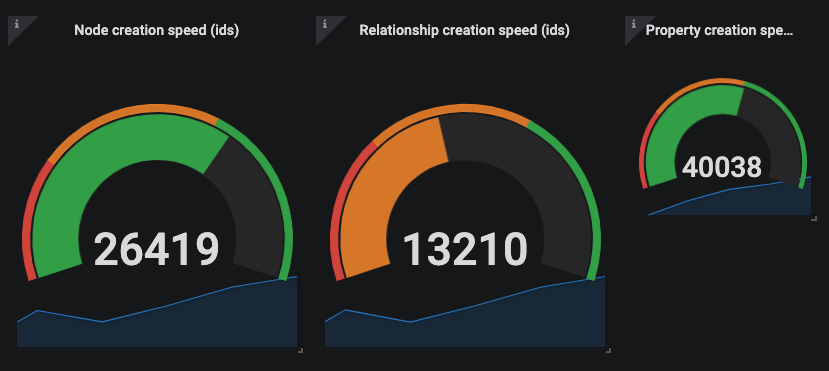
- Janos Szendi-Varga and Miro Marchi have started a series of posts showing how to monitor Neo4j using Prometheus and Grafana. In part 1 they give an overview of database monitoring and show how to publish metrics from Neo4j procedures. In Part 2 they show us how to render these metrics in a Grafana dashboard with a detailed walkthrough.
- Neo4j CEO Emil Eifrem was recently interviewed by Mike Schwartz on the Open Source Underdogs podcast. They talk about startups, entrepreneurship, and open source.
- Amy Hodler and I wrote a guest blog post for the DB Engines blog, in which we showed how to apply graph analytics to the Game of Thrones Graph.
- Abdoul Karim published family-tree-kotlin-springboot-neo4j-graphql, a family tree sample application built using Spring Boot, Kotlin, GraphQL and Neo4j.
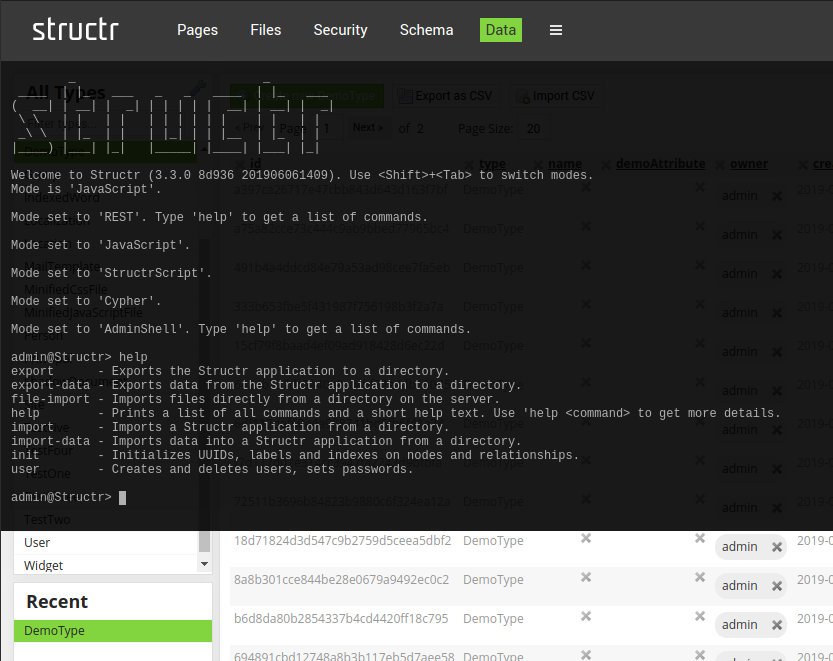
Structr 3.3: Better Security, Data Deployment, Easier Complex Queries

Christian Morgner announced version 3.3 of Structr, the graph application platform. This release adds support for property encryption, data export functionality, and improved query functions.
It also ships with a new license model that should better fit the needs of customers.
Read the blog post
Tweet of the Week
My favourite tweet this week was by Dean Wilson:
Spent a couple of hours experimenting with neo4j and python to model teams, engineers and service ownership. The graph model and cypher queries made it a pleasant distraction.
— Dean Wilson (@unixdaemon) June 14, 2019
Don’t forget to RT if you liked it too.
That’s all for this week. Have a great weekend!
Cheers, Mark


