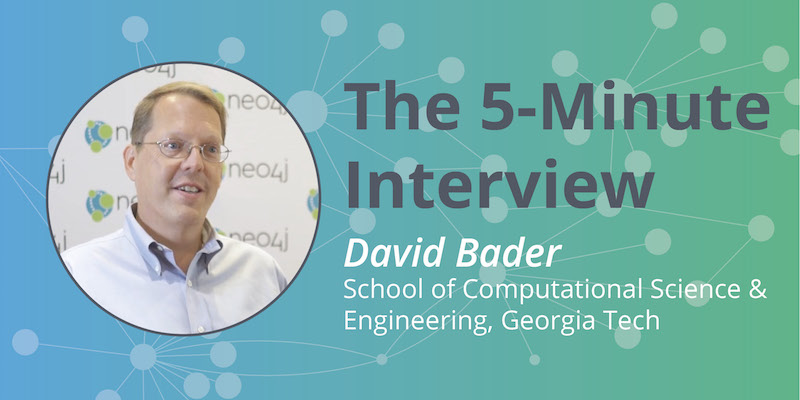
When David Bader started working with graphs 25 years ago, it was a niche that required designing specific algorithms and even specific computers. Now the Neo4j graph database is used widely by analysts and researchers who work with Georgia Tech, rapidly asking questions and visualizing results.
In this week’s five-minute interview (conducted at GraphConnect 2018 in NYC), we spoke with Dr. Bader about using graph technology to solve real-world problems, including a knowledge graph to track emerging problems and threats.
Tell us how Georgia Tech is using Neo4j.
David Bader: The work that we’re doing at Georgia Tech involves real-world graphs. We try to design algorithms that look at problems at a large scale for making the world a better place. We work on improved transportation. We look at security and insider threats and cyber analytics as well as a lot of common problems related to graphs with friendship networks and financial networks.
We really like to innovate with graphs and be able to solve real-world problems that affect every person in the world.
It’s been great working with Neo4j. We use Neo4j in some of our work on creating a knowledge graph to look at emerging problems and emerging threats in the world.
What made you choose Neo4j?
Bader: In our work at Georgia Tech, we work with a variety of analysts, both in the commercial sector and also in government. Many of those analysts use Neo4j at their desktop where they are able to very rapidly ask questions and visualize their answers. It’s a great platform for doing day-to-day work with graphs.
In the work that we do pushing the envelope, we try to integrate with Neo4j so that it has the widest distribution of users across our customer space.
What do you think is in store for the future of graphs?
Bader: Up to now, graphs have really been a utility for doing a forensic analysis of a dataset. What that means is we tell the history using graphs.
Where my research is headed is looking at preventative analytics with graphs. For instance, we would like to discover unknown patterns that may be very important to a business. Or we may be looking at how a graph changes over time as customers come and go or as the world changes around us.
As we move forward, we also will be also inundated with massive streams of datasets and I want to be able to incorporate that into the graph and make decisions in real time on the fly.
What is your favorite part of attending GraphConnect?
Bader: I am intrigued by the community that Neo4j has put together with GraphConnect. When I first started working with graphs about 25 years ago, it was really a niche element where we had to design new algorithms and new computers, all to work with this strange thing called a graph.
When I come to GraphConnect – this is my second year – and see thousands of people here, it’s amazing that this is now mainstream. I see companies ranging from financials to retailers, security companies, and government contractors. I see everyone at GraphConnect that I’d like to meet.
And graphs have gone mainstream in order to make our businesses better, to make our operations more efficient, to work with customers and make recommendations, and to manage our security. In all of these places, we see graphs now as a first-class citizen.
Want to share about your Neo4j project in a future 5-Minute Interview? Drop us a line at content@neo4j.com
Download this white paper, The Top 5 Use Cases of Graph Databases, and discover how to tap into the power of graphs for the connected enterprise.
Read the White Paper


