Full Presentation
Building a knowledge graph sounds tricky enough – but doing so from scratch without any source code sounds like a mission impossible. That’s exactly what I did even though I am not a full-blown developer and don’t write code as my job on a daily basis, which means that you can do it too.
Here is how I built a graph that discovers knowledge about cancer growth discovery, which you can use as a guide to build a knowledge graph from scratch.
Why I Built the Knowledge Graph
It really started with my interest in oncology (cancer research). I have many friends that are affected by cancer. I have seen idols in the business being affected by cancer. And I had a brush with cancer myself, which fortunately turned out to be not serious.
It’s a very non-discriminating disease that can affect basically anybody at any point of time. Treatment of cancer has seen good improvements over the years, but the statistics are still pretty abysmal. If we take a look at the number of deaths predicted in 2019, there’s still a lot of work to be done.

I wanted to learn more about the space, the domain involved in cancer research, what the companies are working on, what types of cancer they’re working on, what kind of molecules or drugs they’re developing and so on. Drug discovery for cancer is a long process and has many components to it.
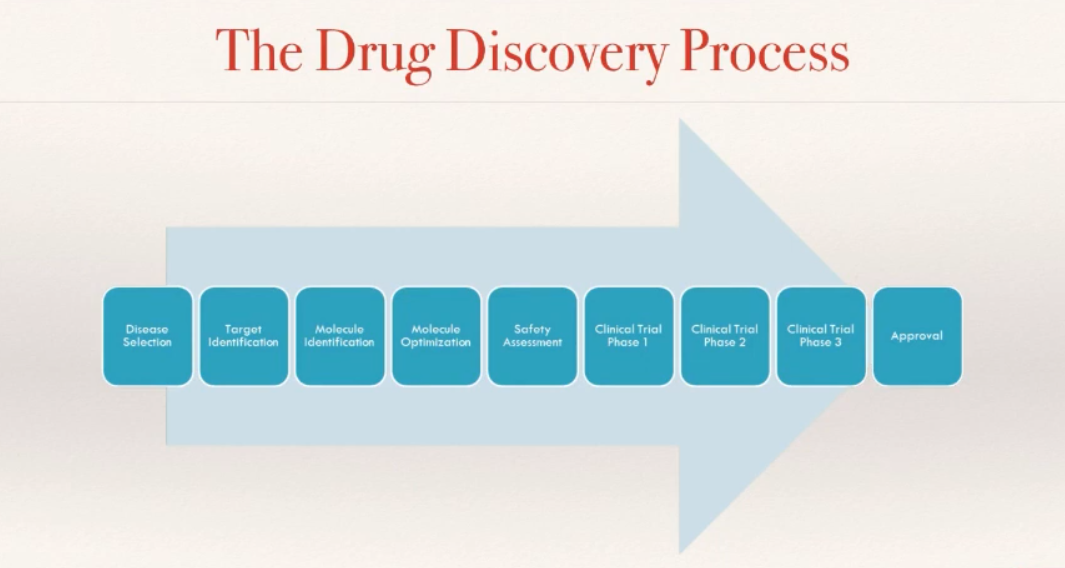
First, you’ll need to know what disease you’re working on and identify your target molecule. Then, the molecules go through some steps to optimize and identify a single molecule, which would be safe for entering various phases of clinical trials before the drug can be approved to the market.
As I was learning, I realized that I can’t keep everything in my head. I need to capture the knowledge somewhere. More precisely, I need a database to capture the knowledge about cancer growth discovery.
Initially, I thought of a relational database. But this fixed schema doesn’t work well for the primary purpose of the database: Knowledge.

Relational databases are perfect for capturing siloed data, things in a particular domain, as shown in the image above. But in order to capture knowledge, I will need to label it, give it some information and context, and connect the dots. This is exactly represented in the shape of a graph.
Knowledge graph immediately appeared as the best option, which would lead me to additional insights and gain wisdom.
The Initial Idea
In this space, we have lots of different companies – startups, medium-sized businesses, and the pharma-giants – all of which are working on something called therapeutic molecules. These therapeutic molecules typically interact with a molecular target, a protein inside your body that has a critical role in the disease process.
In this case, I’m interested in influencing cancer cells with therapeutic molecules, with the help of drugs that would benefit the patient to either stop the cancer from developing or eliminate it altogether. I represented this initial idea in the graph, Competitive Intelligence in Cancer Growth Discovery, which you can find on GraphGist.

This graph model (see graph on the bottom right on the image above) shows a basic network, where a company designs a molecule that acts on a molecular target, and other companies work on a different molecule but act on the same molecular target. It’s the start of a network, but it’s not the end of it.
From my knowledge graph, I want to get the answers to simple as well as complex questions. For instance, I want to quickly see if I can look up a molecule by its name or any alternate names that this molecule might be known by.
But I also want to ask more complex questions like:
- Which of these molecules interact with a specific molecular target or a target family?
- What is the drug pipeline for a specific company?
- Which molecules are they developing on their own, and which molecules are they developing in collaboration with others?
- Which companies are working on therapeutic molecules that act on a specific molecular target, and which diseases are they targeting?
- Which therapeutic molecules are in a particular phase in the clinical trial that is targeting breast cancer?
Starting from Scratch
I created some input screens to enter the initial concepts about companies and the basic information that I wanted to know, such as name, description, maybe image, and then potential link-outs to other information that I didn’t want to capture directly in my knowledge graph.
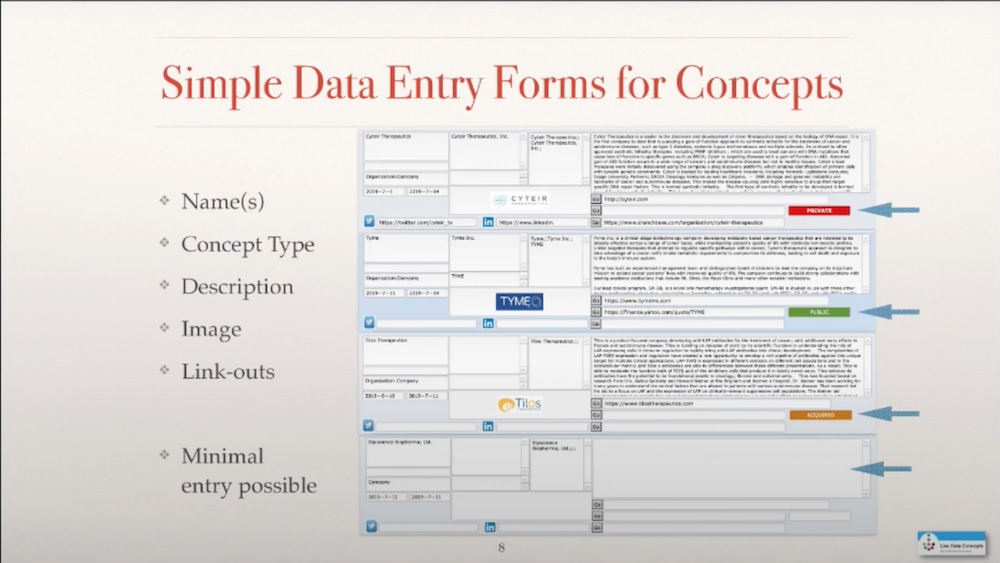
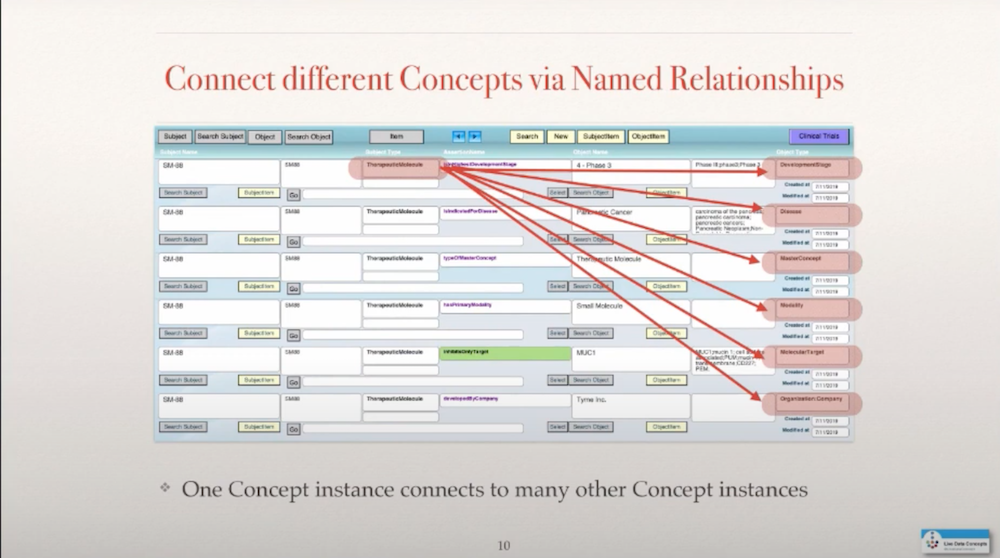
I wanted to also have the option to have the minimal entry possible because sometimes all I knew was the name of something and then that would be connected to other things, which means I needed relationships. I needed to figure out how to connect a molecule, for example, a subject, with an object, with a company, in this case, through a named relationship.

So I defined my relationships by giving them properties such as developed by company or has location in city. I can use that also as a potential filtering mechanism in the future, once I have a knowledge graph in place. And, in addition, there were some link-outs to other source information and buttons for a quick look-up. A molecule is connected not just to a company but also to a lot of other information that one would like to know about a particular drug molecule in a pipeline, such as the highest clinical trial phase that this molecule might be in, what it potentially is indicated for, what type of molecule it is.
If you’re familiar with this space, traditionally a drug was just a small molecule, a chemical that you consumed in a pill form, but the biotech industry started to bring proteins that typically had to be injected into the mix and now the design has gone much further where proteins and small molecules are combined in quite sophisticated structures. Sometimes we even have cells that are now used as drugs.
I had designed this in FileMaker Pro initially by setting up two tables, one for subjects, one for objects, and then another table that connects everything together. I didn’t know Neo4j or property graph model at the time when this started but it allowed me to collect some data over time and then I came across Neo4j, which is exactly what I need.
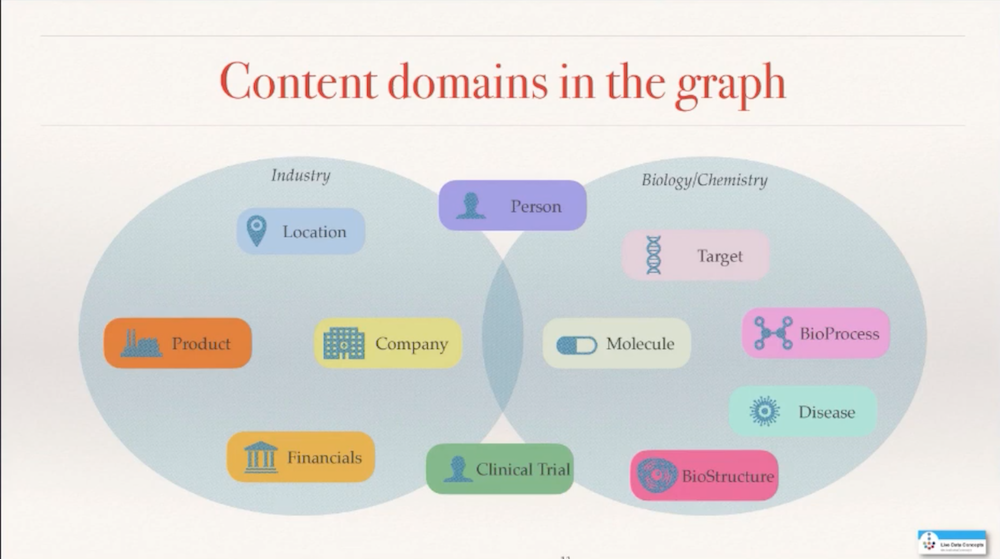
I started out with a simple set of concepts. It grew over time and is still growing. I started to get into the actual products that companies sell and into the financials that gives me a perspective of how profitable some of these drugs are. Then I also wanted to get into the biology and the chemistry more, and started adding bioprocess or biological structure, in addition to the target, the molecule, and the disease. So the graph is still growing as it is, as more data becomes available and as additional questions may come to the foreground.
I didn’t have Neo4j, and I also didn’t want to enter all the data manually. So I looked into ClinicalTrials.gov which lists all the companies that are actually developing drugs and enter them into human trials, and set up a script that allowed me to semi-automate and extract transform loads from that database on a weekly basis. So I extract the data from clinical trials weekly and then go through this process by looking up cancer-related entries and assigning them.
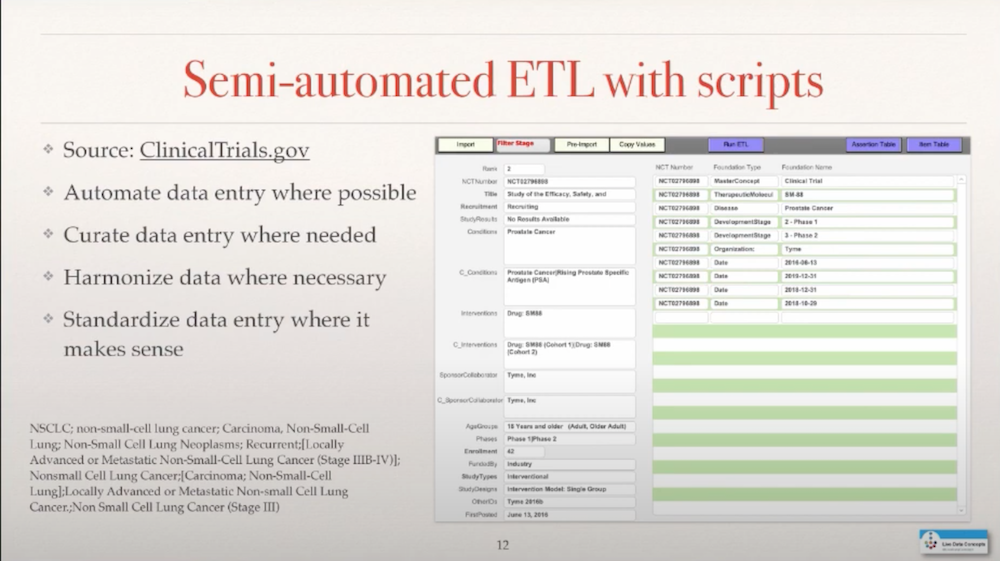
One of the issues is that the terminology that is used to describe a disease or a drug is not very strict in this database so if you really wanna harmonize some of that, it requires some manual intervention in this ETL process to establish the proper connections. That is a process that I go through, it’s quite labor-intensive, and you also need to have the knowledge, at times, to make the right decisions to bring this data together.

This database is not large. This is not about big data. But it’s about highly connected data. At this point, I had up to about 86 different types of data, 160 relationship types that connect these different node types together, 16,000 nodes, and 89,000 relationships.
The majority is clinical trial data, with lots of dates associated with it. Then we have the therapeutic molecules, which are kind of at the center of this graph, the molecular target, and the organization.
Transferring Data into Neo4j
I had the data in the FileMaker database, but how do I get it out into Neo4j? I resorted to a pipelining tool called KNIME, an open-sourced tool which is actually quite great to read in files, then process it, manipulate it somehow, and then potentially write files again. So I exported data out of FileMaker, then did some transformation in there to create load CSV files that could be used then in a script that I would run to get the data into the Neo4j database.
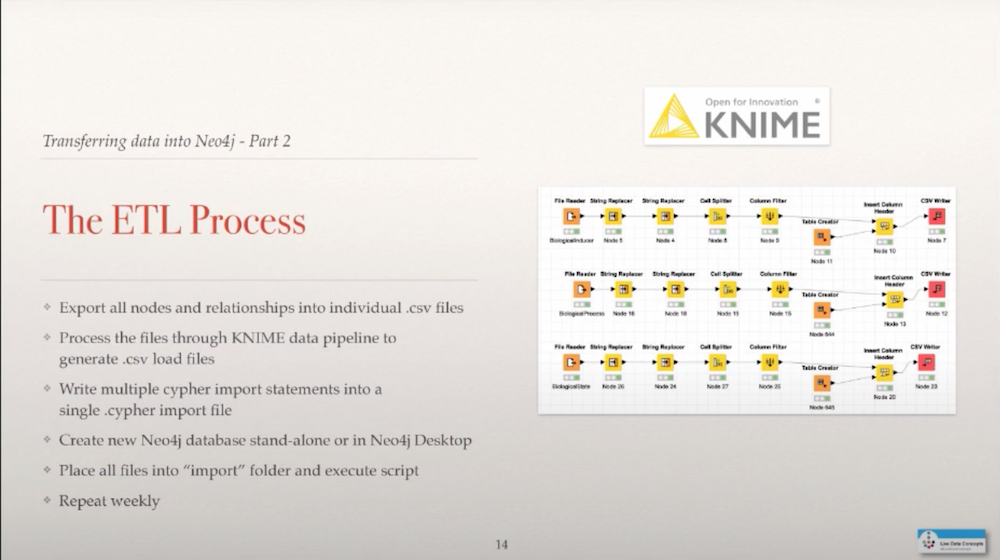
I started off with a stand-alone database, community edition, initially, and then when Neo4j offered the opportunity to get into Neo4j Desktop, I switched over to using Neo4j Desktop to store the knowledge graph.
The load process: I wrote the script in Sublime Text to initially just define some simple constraints. I have some unique identifiers for each node type and I have a uniqueness constraint on the name to make sure that I avoid duplicates because that is something that you can come across quite often, especially when you’re dealing with things like molecules that have many different names throughout the development process. But I wanted to represent it only once in the database, not 15 different ways just because they have a different name.
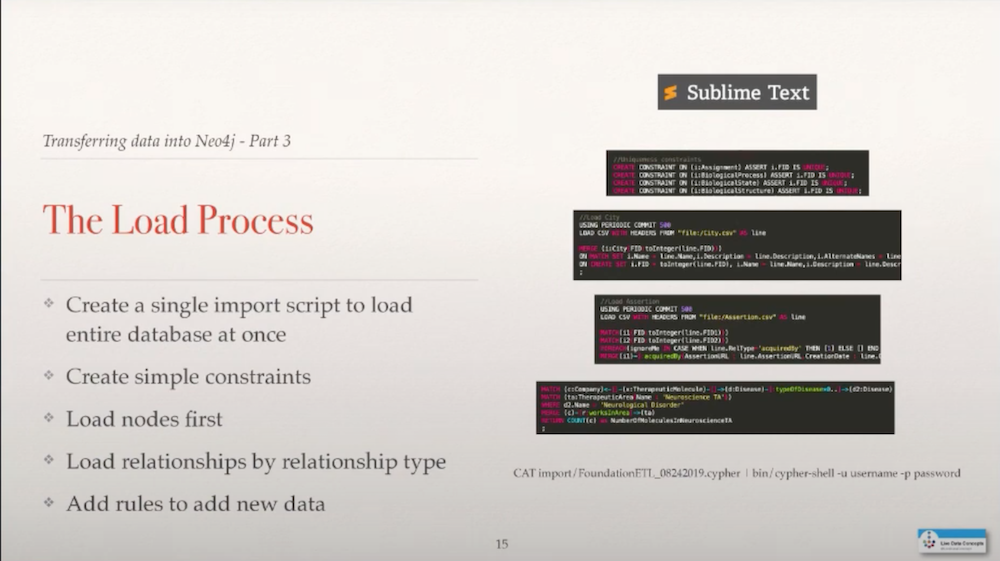
I loaded the nodes first, a very simple script here, followed by the relationships which I put together by looking up the nodes initially and then assigning a particular relationship based on the value that I had extracted from the FileMaker database.
And last but not least, I also looked into using Cypher to add some content into the data based on the data that was actually there, such as associating a company to a therapeutic area, a particular disease area that they might be working on based on the type of molecule and the disease that the molecule is supposed to address. And that all went into one file and one Cypher statement and that is used to basically load the database.
The Technology Stack
The technology stack that I used to build all this is FileMaker Pro Advanced, to enable me to write scripts and capture the data initially, the ETL process through KNIME, and a load script – getting it into Neo4j which gave me the ability to write queries through Cypher.
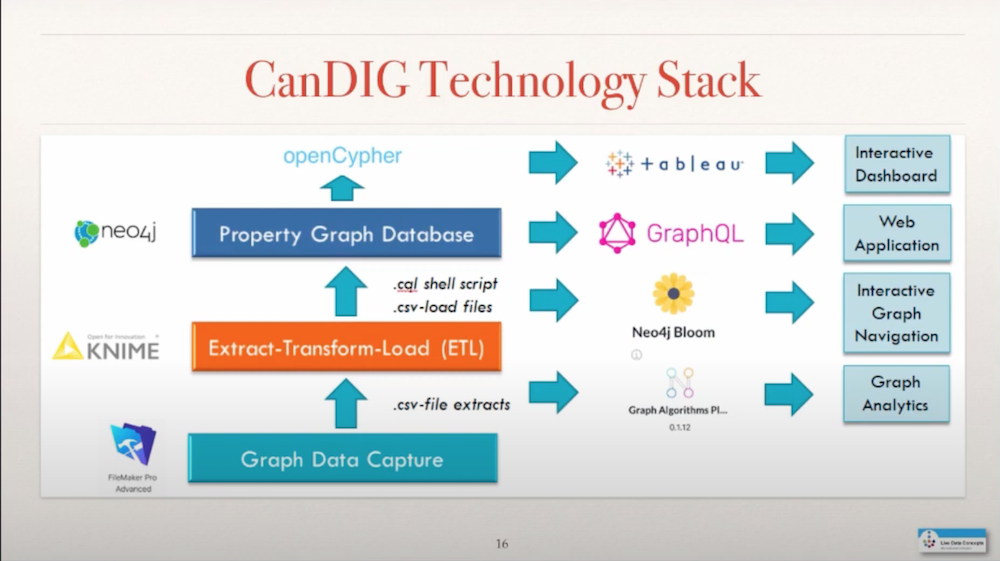
Cypher allows me to actually answer the questions that I set out in the very beginning to this knowledge graph through APOC, Awesome Procedures on Cypher. I can put this data into Tableau to create a dashboard. I can create a GraphQL API. I can visualize this data in Neo4j Bloom. I can also use the Graph Data Science Library to run graph analytics.
Demo Time
I’m going to show you a demo of navigating through my knowledge graph, with an example of a molecular target that actually has been in the press quite frequently recently because it is a cancer oncogene that has been very resistant to being targeted by a drug.
Conclusion
The world is highly connected. Knowledge graphs really open the door for me to capturing, learning, understanding or interrogating complex data landscapes to gain additional insights. I just want to say thank you to everybody who makes open source tools available to a broad audience so they can explore these new opportunities.
If you’re interested in this knowledge domain, connect with me!
Thinking about building a knowledge graph?
Download The Developer’s Guide: How to Build a Knowledge Graph for a step-by-step walkthrough of everything you need to know to start building with confidence.


