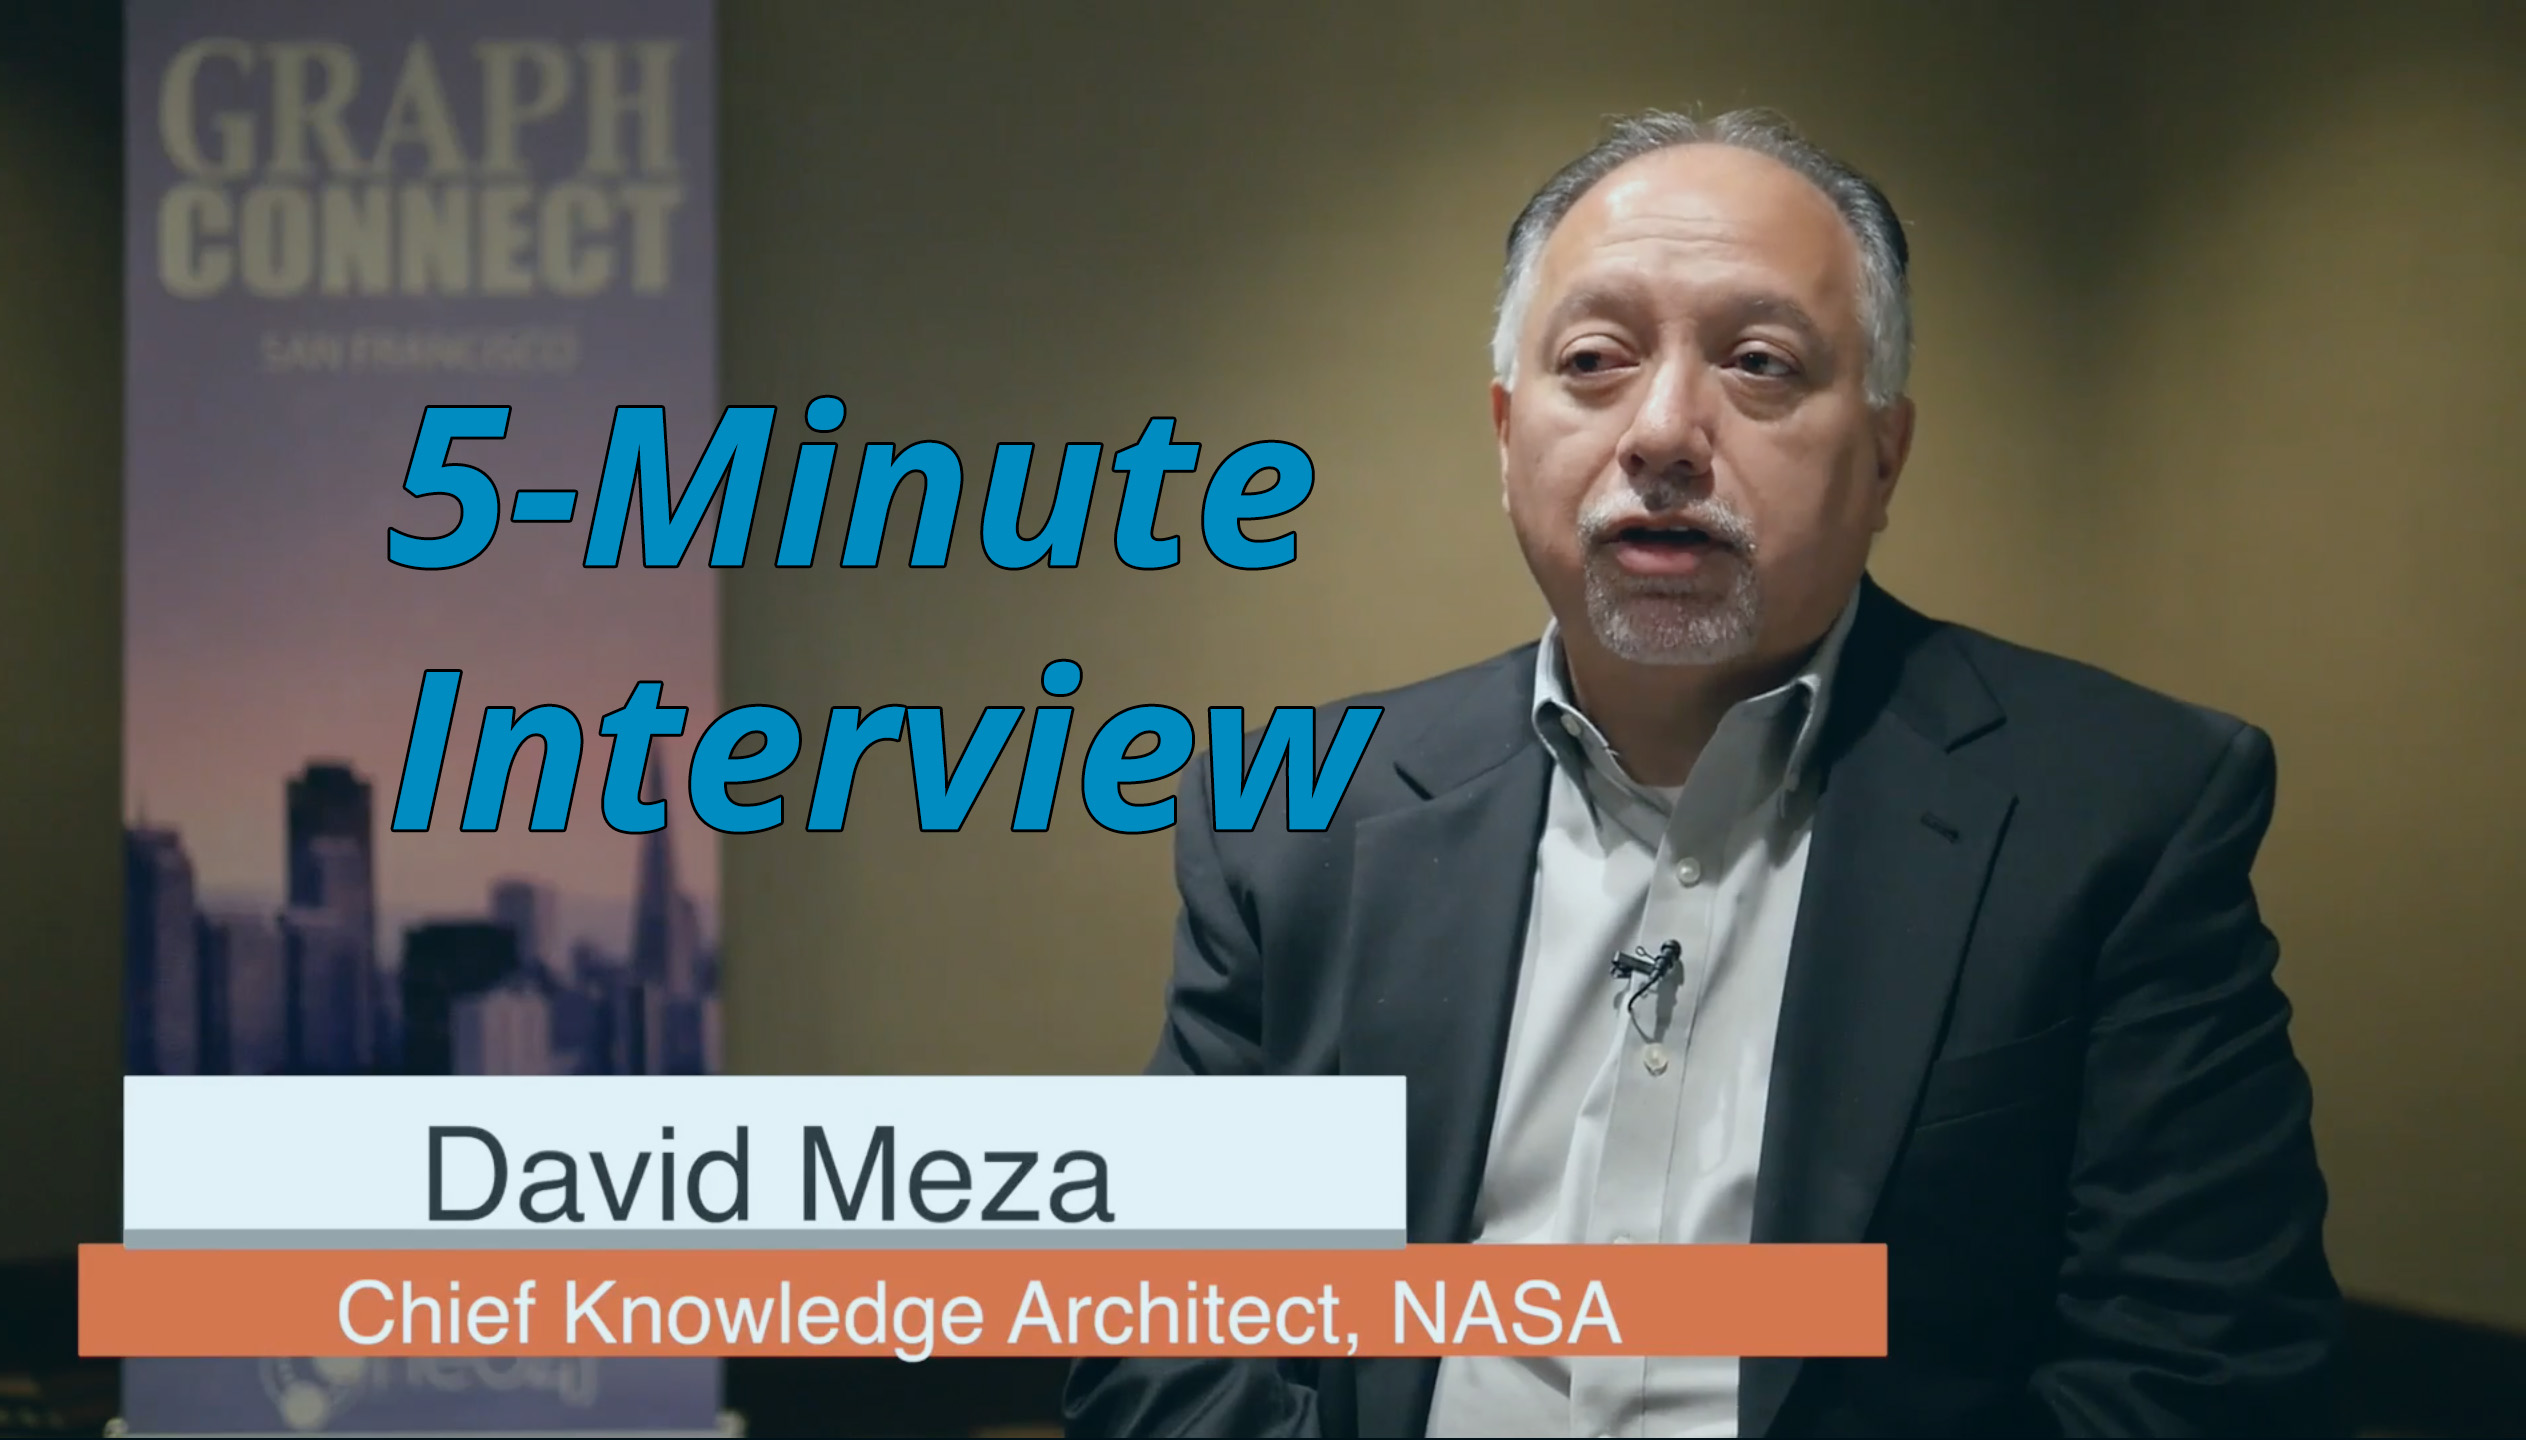
The 5-Minute Interview: David Meza, Chief Knowledge Architect, NASA

Editor-in-Chief, Neo4j
3 min read

For this week’s 5-Minute Interview, I chatted with David Meza, Chief Knowledge Architect at NASA Johnson Space Center in Houston. I caught up with David at GraphConnect San Francisco.
Here’s what we talked about:
Tell us a little bit about how you use Neo4j at NASA.
David Meza: There are a lot of different projects we’re working on. When I first started working with Neo4j about four years ago, I wanted our engineers and scientists to be able to explore our “lessons learned” database much more efficiently. We had been using a standard key list search, but needed to examine the data relationships between different lessons learned over the last 50 years from a variety of eras — such as the Apollo, shuttle and Orion eras.
Graph databases simplified that process for us by connecting lessons across those spectrums, and even helped prevent future problems from arising. Recently, using Neo4j someone from our Orion project found information from the Apollo project that prevented an issue, saving well over two years of work and one million dollars of taxpayer funds.
What made you choose Neo4j?
David: For me, utilizing this type of technology was a no-brainer. I’ve used relational models for many years, starting back to mind-mapping during meetings. Neo4j really stood out as something that made sense to me, both from a logical standpoint and a visual standpoint. It made it really easy for our end users to visualize that data, see connections, find out how the data was being impacted and to find information much more quickly.
What are some of the most surprising or interesting results you’ve seen from using Neo4j?
 David: Like I mentioned earlier, it allowed us to save a lot of time and money on the Orion project. It has also provided us with a way to connect the dots between a lot of siloed repositories.
A current project we’re working on is recording comments from astronauts as they come off the space station. This allows us to connect their experiences with those of astronauts over the last 10 or 15 years, which we can then tie to subsequent actions and projects. Previously, this information was stored in separate silos. Now we’re able to connect the dots and uncover trends across the years as to what systems and subsystems may have been impacted by experiments we’re running in the space station.
If you could take everything you know about Neo4j and go back to when you first started, would you do anything differently?
David: If I could look at Neo4j today and go back to my first project, I would make sure to have a better understanding of our data model. It was a bit of a learning curve to transition from a relational database and SQL mentality to graph. I had to throw away the schema mentality and start fresh to be able to model effectively and shift my thinking top relationships and connections.
Any other thoughts or comments you’d like to share?
David: I’d like to comment on Neo4j’s scalability and capability of looking at millions and millions of nodes. We have a “big data” problem — not only in structured data, but in unstructured data — and we are continually gathering more data. At NASA, my focus right now is on the unstructured data. And I need a product or an application that can go across and develop millions if not billions of nodes, connect that information and at fast speeds. Neo4j is that tool.
Want to share about your Neo4j project in a future 5-Minute Interview? Drop us a line at content@neo4j.com
Download this white paper, The Top 5 Use Cases of Graph Databases, and discover how to tap into the power of graphs no matter your industry or dataset.


