OSCON Twitter Graph

Developer Relations
4 min read
OSCON Twitter Graph
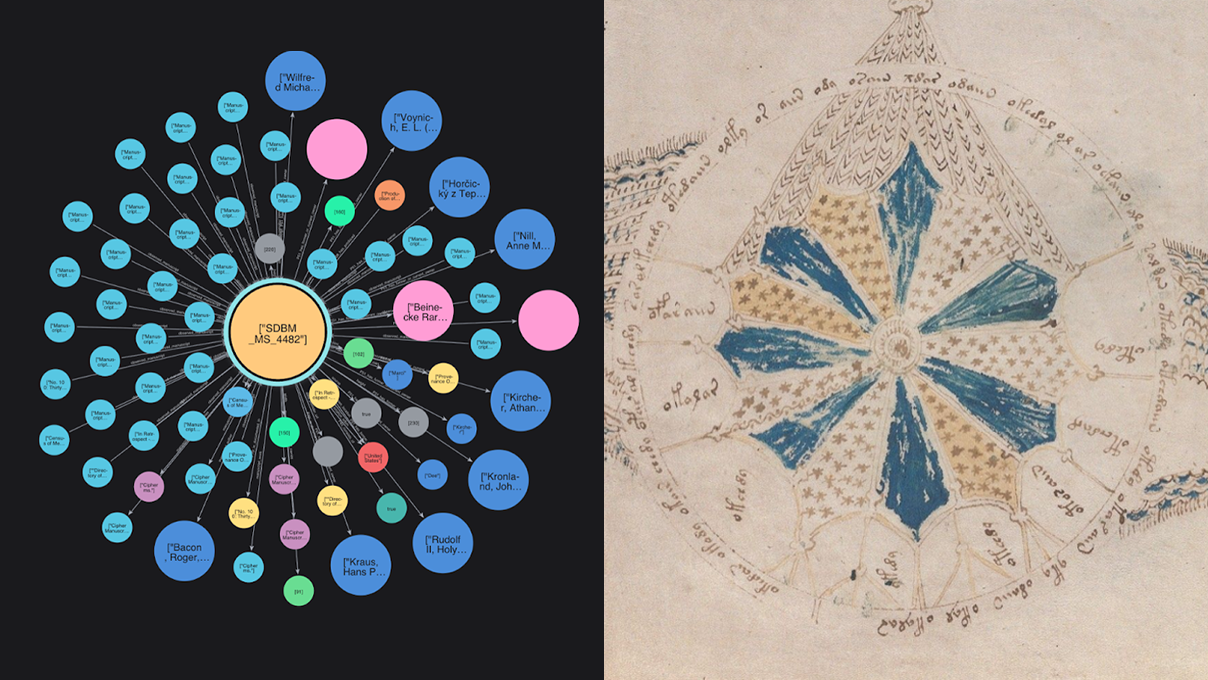
As a part of Neo4j’s community engagement around OSCON, we wanted to look at the social media activity of the attendees on Twitter. Working with the Twitter Search API and searching for mentions of “OSCON”, we wanted to create a graph of Users, Tweets, Hashtags and shared Links.

The Twitter Search API returns a list of tweets matching a supplied search term. We then populated the graph model that is shown above by representing the results as nodes and relationships, achieved through using Neo4j’s query language, Cypher.
We designed a single Cypher query to import each tweet into the graph model in Neo4j. This is achieved using a single parameter that contains all of the tweets returned from Twitter’s Search API.
Using the UNWIND clause we are able to pivot a collection of tweets into a set of rows containing information about each tweet, which can then be structured into the outlined graph model from the image.
UNWIND {tweets} AS t
MERGE (tweet:Tweet {id:t.id})
SET tweet.text = t.text,
tweet.created_at = t.created_at,
tweet.favorites = t.favorite_count
MERGE (user:User {screen_name:t.user.screen_name})
SET user.profile_image_url = t.user.profile_image_url
MERGE (user)-[:POSTS]->(tweet)
FOREACH (h IN t.entities.hashtags |
    MERGE (tag:Hashtag {name:LOWER(h.text)})
    MERGE (tag)-[:TAGS]->(tweet)
)
… source, mentions, links, retweets, ...
We used this Cypher query to continuously poll the Twitter API on a regular interval, expanding our graph from the results of each search.
At the time of writing this we have imported the following data:
|
Labels |
Count |
|
Tweet |
10653 |
|
User |
4910 |
|
Link |
1153 |
|
Hashtag |
742 |
|
Source |
175 |
With this, we are able to answer many interesting questions about Twitter users at OSCON.
For example, which platform are users tweeting from most often?
MATCH (t:Tweet)-[:USING]->(s:Source)
RETURN s.name as Source, count(t) as Count
ORDER BY Count DESC
LIMIT 5
|
Source |
Count |
|
2294 |
|
|
1712 |
|
|
1590 |
|
|
877 |
|
|
668 |
Which hashtags co-occur with #python most frequently?
MATCH (:Hashtag {name:'python'})-[:TAGS]->(:Tweet)<-[:TAGS]-(h:Hashtag)
WHERE h.name <> 'oscon'
RETURN h.name AS Hashtag, COUNT(*) AS Count
ORDER BY Count DESC
LIMIT 5
|
Hashtag |
Count |
|
java |
7 |
|
opensource |
5 |
|
data |
5 |
|
golang |
5 |
|
nodejs |
5 |
Which other topics could we recommend for a specific user?
Finding the most frequently co-occurring topics to the ones they used and that they haven’t used themselves.
MATCH (u:User {screen_name:"mojavelinux"})-[:POSTS]->(tweet)
    <-[:TAGS]-(tag1:Hashtag)-[:TAGS]->(tweet2)<-[:TAGS]-(tag2:Hashtag)
WHERE tag1.name <> 'oscon' AND tag2.name <> 'oscon'
AND NOT (u)-[:POSTS]->()<-[:TAGS]-(tag2)
RETURN tag2.name as Topics, count(*) as Count
ORDER BY count(*) DESC LIMIT 5
|
Topics |
Count |
|
graphdb |
30 |
|
graphviz |
24 |
|
rstats |
21 |
|
alchemyjs |
21 |
|
cassandra |
21 |
Which tweet has been retweeted the most, and who posted it?
MATCH (:Tweet)-[:RETWEETS]->(t:Tweet)
WITH t, COUNT(*) AS Retweets
ORDER BY Retweets DESC
LIMIT 1
MATCH (u:User)-[:POSTS]->(t)
RETURN u.screen_name AS User, t.text AS Tweet, Retweets
|
User |
Tweet |
Retweets |
|
andypiper |
Wise words #oscon https://t.co/f4Jr9hnMcV |
470 |
Wise words #oscon pic.twitter.com/f4Jr9hnMcV
— Andy Piper (@andypiper) July 20, 2014
To test your own queries on this graph model, check out our GraphGist.
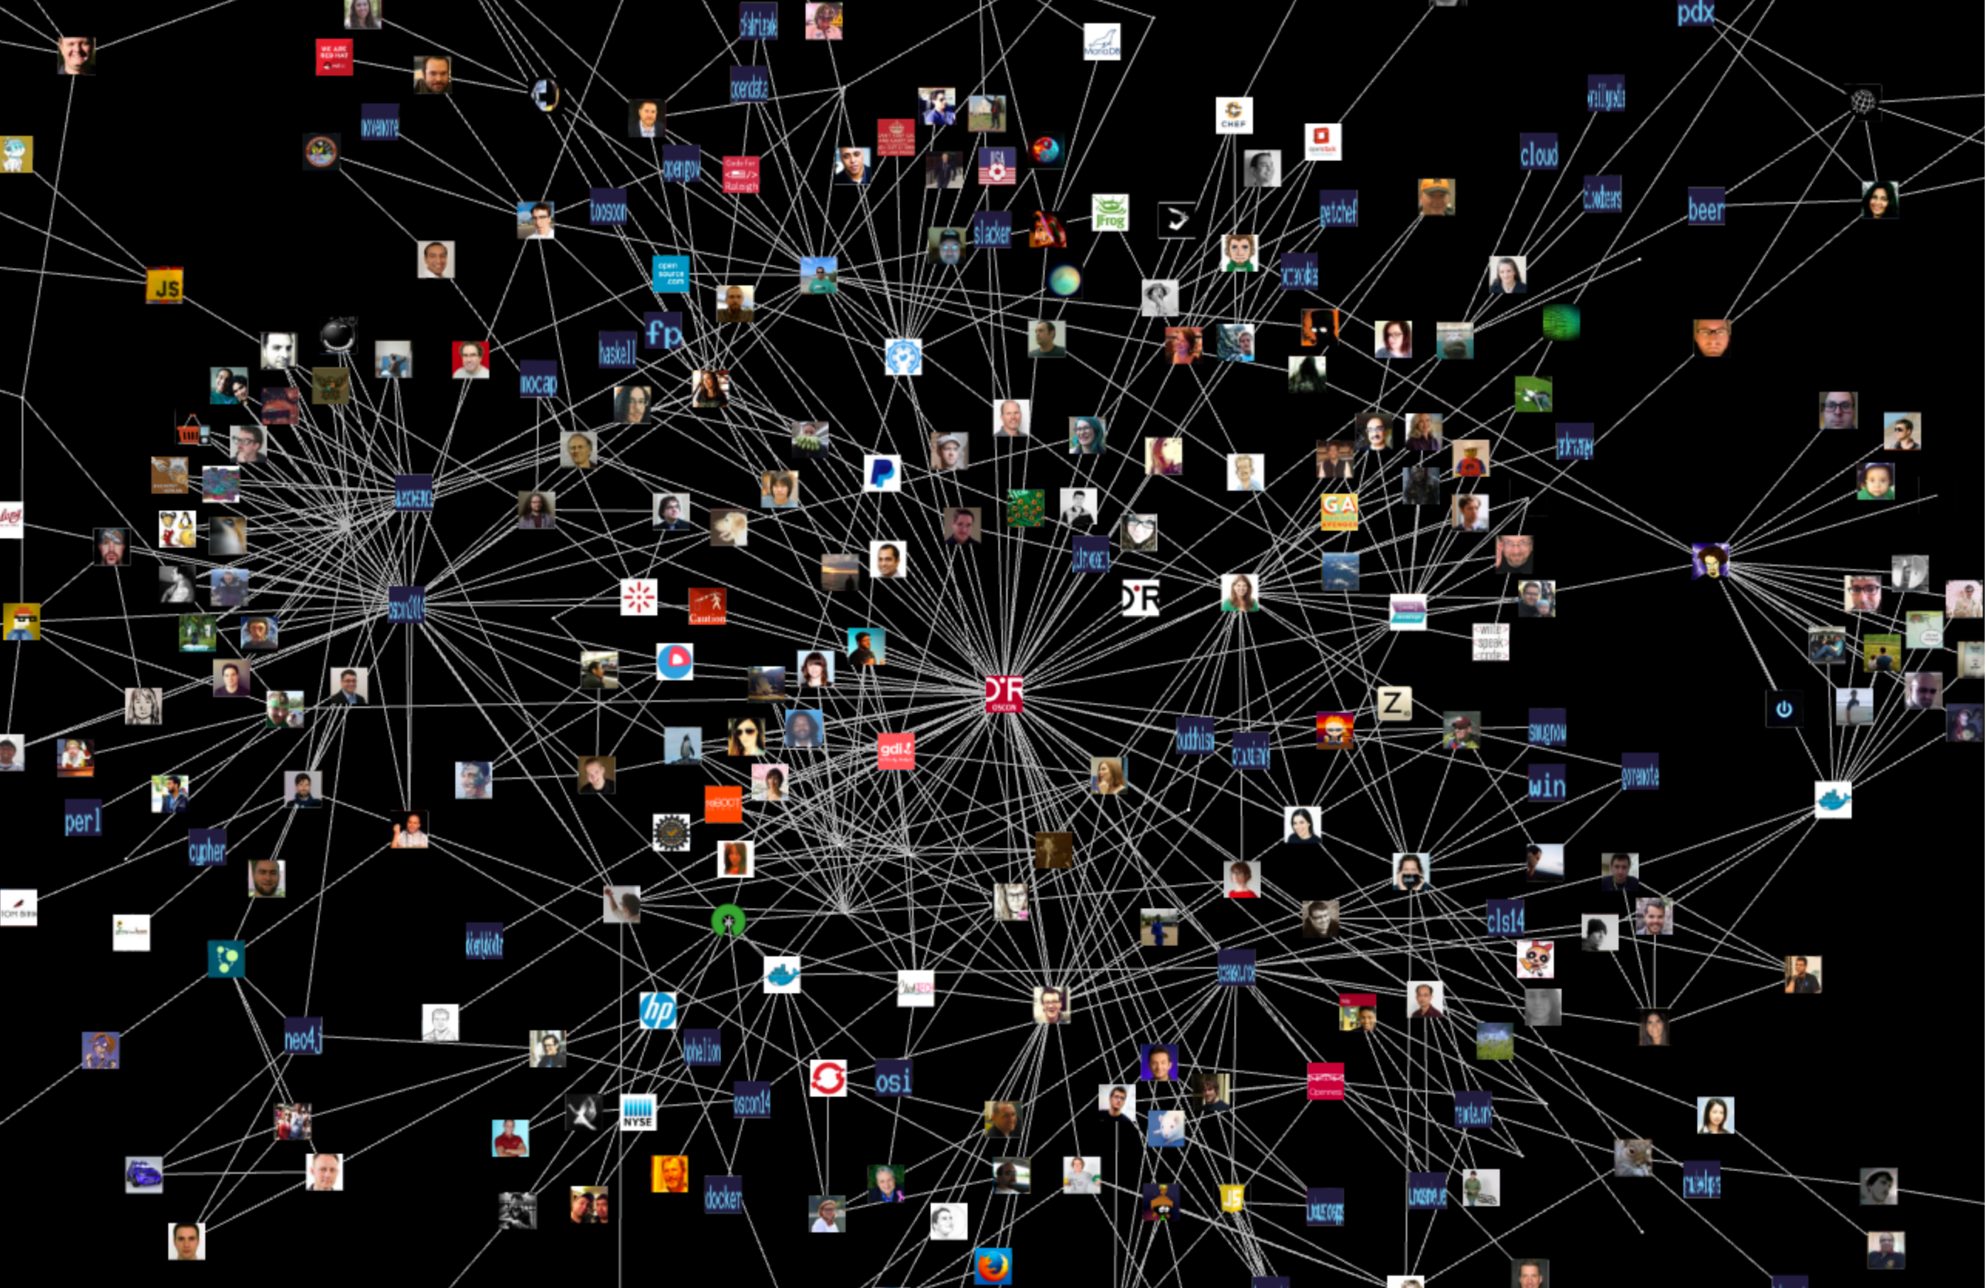
Graph Visualization
The interesting aspect of this tweet-graph is that it contains the implicit connections between users via their shared hash tags, mentions and links. This graph differs from the “official” followers graph that Twitter makes explicit. Via the inferred connections we can discover new groups of people or topics we could be interested in.
So we wanted to visualize this aspect of our graph on the big screen. We wrote a tiny python application that queries Neo4j for connections between people and tags (skipping the tweets in between) and makes the data available to a JavaScript front-end.
The query takes the last 2000 tweets to analyze, follows the paths to tags and mentioned users and returns 1000 tuples of users connect to a tag or user to keep it manageable in the visualization.
MATCH (t:Tweet)
WITH t ORDER BY t.id DESC LIMIT 2000
MATCH (user:User)-[:POSTS]->(t)<-[:TAGS]-(tag:Hashtag)
MATCH (t)-[:MENTIONS]->(user2:User)
UNWIND [tag,user2] as other WITH distinct user,other
WHERE lower(other.name) <> 'oscon'
RETURN { from: {id:id(user),label: head(labels(user)), data: user},
    rel: 'CONNECTS',
    to: {id: id(other), label: head(labels(other)), data: other}} as tuple
LIMIT 1000
The front-end then uses VivaGraphJS, a WebGL enabled graph rendering library to render the Twitter activity graph of OSCON attendees. We use the Twitter images and hash tag representations to visualize nodes.

Want to learn more about graph databases? Click below to get your free copy of O’Reilly’s Graph Databases ebook and discover how to use graph technologies for your application today.
Share Article


Explore
Related Articles