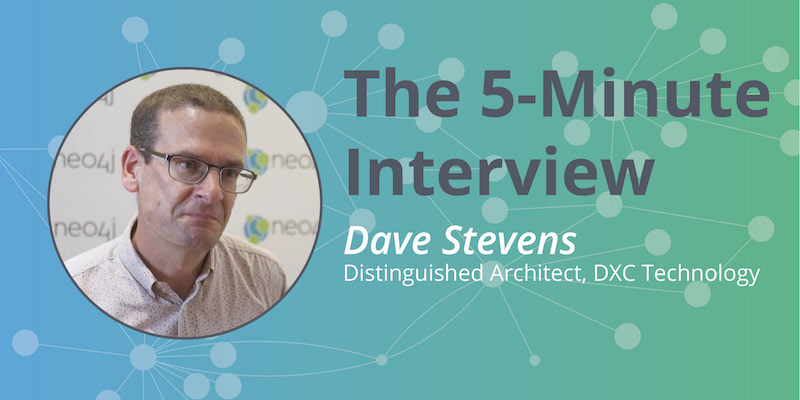
DXC Technology is a service provider, helping clients deal with massive shifts around digital disruption and digital transformation. Graph technology enables DXC to dynamically track influences and relationships between industry trends, client roadmaps and implementation projects.
In this week’s five-minute interview (conducted at GraphConnect 2018 in NYC), we spoke with Dave Stevens, Distinguished Architect at DXC Technology, about how Neo4j unlocks new views into their data and how he knew they needed a native graph database, not a graph virtualization layer.
Tell us about how DXC is using Neo4j.
Dave Stevens: Industries are being disrupted from many, many directions, and we need to be able to understand what’s happening. We have to understand all the relationships and influences.
Neo4j was the means to allow us to model the industry and our clients’ roadmaps and then create a technical representation of the solutions that we ultimately deliver. Those three models are connected, and we can only do that using Neo4j.
What made you choose Neo4j?
Stevens: We originally chose Neo4j because we wanted to try something different. I was given some time to investigate the dimensions and dynamics of model-based data. We did four sprints over eight weeks. By creating a whiteboard model, transposing it into the data and loading the data in very quickly, we realized that there was something more here than we originally realized.
Our use of Neo4j grew from that point. Nothing else out there was even getting close. I had DBAs coming in and saying, “Hey, I can just put a graph virtualization on top of Oracle for you.” No, I’d say, I don’t want that. I want the connections, the paths and the analytics that Neo4j is going to give us in the long run.
What have been some of the most surprising results you’ve seen from Neo4j?
Stevens: There are a couple of dimensions to our experience of using Neo4j. Speed of development has been tremendous, in terms of realizing the data, data modeling and getting data in.
The second dimension is looking at analytics and understanding what we can do with it. We had an original scope and that progressed very quickly, visualizing data on a standard web front end, building a whole application around that and on-boarding people.
But as soon as we started looking at that data and understanding it, it led to new things. We began to think, where else is this taking us? What have we seen? What didn’t we know before?
If you could go back to when you first started using graphs, what would you change?
Stevens: We first approached graphs in a bit more of a traditional sense. Our first module was pretty big, both in terms of the data model and in terms of the number of nodes.
When we look at the new modules that we’re running, we are disconnecting things and making more connections. We are gaining agility in the sense of being able to develop faster. In addition to having a microservices based application architecture, we are moving toward a microservices view of the data as well.
Our original data models weren’t fully graphed, if that’s a word. Our lessons learned involved doing more with the data and approaching it in a different way. I think that would be one area that we would look at again if we were starting over.
What do you think is in store for the future of graphs?
Stevens: I think graphs are transforming the way that we are approaching our client conversation and understanding what we are doing. Neo4j is unlocking new views that we haven’t seen before.
One of the core aims of our applications is recommendations. That expands beyond building a client roadmap to using a recommendation engine for this industry and to say, other accounts in this industry have started talking about these types of progressions within their roadmaps.
That level of recommendation just explodes because we then bring it together in terms of recommended to the client, recommended internally as a sort of aggregate of all of that view and making better investment decisions. And then the beauty and the power of that is you then add in the knowledge dimension, making sure that people are ready.
It’s a matter of seeing what’s coming and preparing an organization for what’s coming before it’s there. I’m planning for what’s coming, not just with a more traditional investment review board but based on facts as well.
Want to share about your Neo4j project in a future 5-Minute Interview? Drop us a line at content@neo4j.com
Download this white paper, The Top 5 Use Cases of Graph Databases, and discover how to tap into the power of graphs for the connected enterprise.
Read the White Paper


