Extensive Representation of Contact Tracing with Neo4j in the Canton of Geneva
4 min read
The COVID-19 pandemic has illustrated the importance of network analysis to the world in general. Indeed, the R0 index literally assesses how many people were in close relation to someone else so that they were infected by the index case. In order to control the spread, blocking transmission chains by putting people in isolation or quarantine is vital.
Advantages of Graph Visualization
In this framework, providing an easy interface to visualize data can really help surgeon general offices and public health officers to understand transmission chains and accelerate contact tracing. Indeed, visualizing transmission chains as graphs has three main advantages:
- Transmission can occur at a restaurant, within a household, at work, while on a trip, etc. Assuming that one has access to data on these contacts, graphs can facilitate being aware of all such potential transmission occurrences without the contact tracer taking the time to run queries within each data source.
- Graphs can easily add information of the date of potential transmission – for instance, date of positive test for an index case, date of last contact between a case and a contact, date of restaurant visit, etc. Adding this information to a transmission chain graph helps clinical decision on who could be infected by who and facilitates backward tracing, in addition to forward tracing.
- Since COVID-19 is prevalent, there are a huge number of transmission chains. In addition, index cases may not have disclosed all their contacts, and thus data may not be complete. Because of that, it is difficult to determine which chains of transmission should be investigated first. Some transmission chains are not very infectious and require less resources to stop, for instance if contacts were rapidly found and put in quarantine. Graph statistics could be used for resource allocation, ranking transmission chains and helping contact tracing teams determine which chains should be prioritized.
The difficulty arising from the COVID-19 pandemic, however, is that the pace of infection is very fast and the visualization needs cannot really be defined a priori, due to the extremely dynamic epidemiological situation.
Neo4j for Contact Tracing
Neo4j allows us to initially focus on the data modeling, remaining as close as possible to the fundamentals of the disease and its environment.
We also need a good access control mechanism and a browser interface to allow for easy access to healthcare professionals, features that are readily available with Neo4j. The plugin/app mechanism then allows us to build the last layer more responsively to the needs expressed by healthcare professionals.
Finally, the enterprise edition facilitates in hosting different databases and examining different generations of our model side by side.
Case Study: How Graph Visualization Traces Contact
In the Geneva canton, Switzerland, the Office of the Surgeon General collects all results from laboratories performing SARS-CoV-2 testing. All positive cases indicate their contacts with their date of last contact.
Data on persons present at a given time in restaurants, nightclubs and other venues are collected if a positive case is detected at the same place and time. Finally, data on persons coming back from countries or regions considered at risk are also collected, with their associated date of leaving the country. People living in the same building or working at the same address are considered as having an association.
Using the data from the Geneva canton, the following case study illustrates the advantages presented above. To make things more interesting, let’s present it as a whodunit.
Imagine a contact tracer looking for the direction of the infection. In the image below, which clues are available to determine the most probable direction of infection? Did case X infect case Y? Or did case Y infect case X?
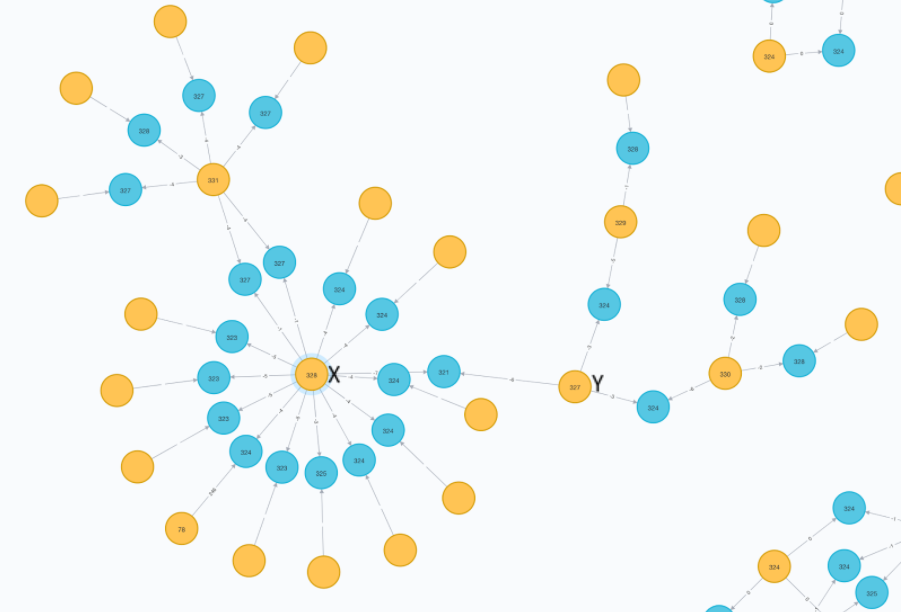
This is a single transmission chain, stopped at the last person without further contacts. Yellow circles are persons. Blue circles are contact events or exposure. The number in the circles are the number of days since January 1st, to facilitate understanding the timeline of infections. Circles without numbers indicate contacts who did not become positive.
Here are some facts we know, based on the dates and sources of exposure:
- X and Y met at an event on day 321.
- Y is in relation with two other people, infected probably during an event on day 324. It could be assumed that Y may have infected two people who became sick 5 and 6 days later respectively.
- X was in contact with many people on day 323, 324, and 325, mostly at work, and none developed symptoms.
- X was in contact with someone through two different exposures on day 327, and this person became sick at day 331.
Based on these facts, it can be deduced that Y is probably the person who infected X, since it seems Y was infectious earlier, especially around day 324, when X did not seem to be infectious.
If that’s correct, it means we do not know who infected Y, who seems to be a relatively prolific spreader and therefore is worthwhile to investigate in detail.
Conclusion
COVID-19 is a very difficult disease to trace and isolate, due to the fact that people are infectious before they show any symptoms. Furthermore, it is quite infectious and, without measures, spreads quickly in the population, reaching vulnerable and older people and quickly submerging healthcare systems.
Any technology that can support healthcare professionals as they trace contact and reduce transmission is worthwhile. The first step is of course having appropriate databases to collect data and provide rapid and accurate results to patients and public health authorities. One of the best solutions to make sense of such a huge amount of data is graph database technology, with particular emphasis on accurate information on proximity in time and space.


