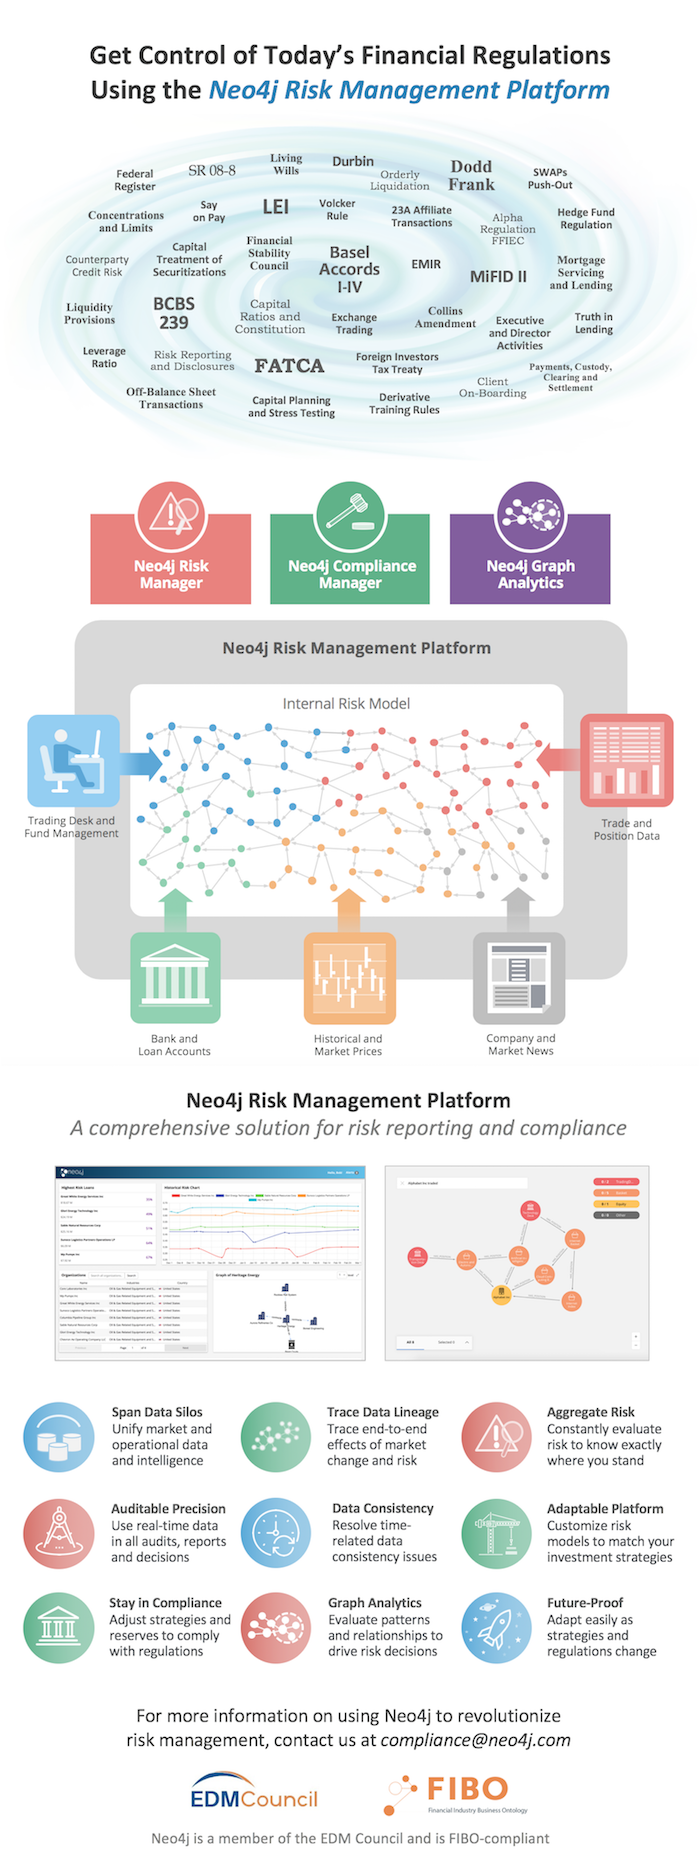
Various authorities creating compliance laws include a cast of six federal regulating agencies: The Federal Reserve, Office of the Comptroller of the Currency, the National Credit Union Administration, the Federal Deposit Insurance Corp., the Securities and Exchange Commission and the Office of Thrift Supervision. And, there’s also state bank regulators, adding even more agencies (and regulations) into the swirling, whirling mix you so desperately want (nay, need) control of.
There’s no doubt financial risk management has become chaotic, especially if you’re saddled with the task of trying to connect siloed data for comprehensive, accurate and on-time reports.
In this infographic, you’ll learn how a graph database is the key to creating a risk management solution for true risk reporting and compliance.
Graph technology unifies your market and operational data with end-to-end tracing of market change and risk. Bringing precision and consistency to risk management, graph analytics then allow you to evaluate data patterns that drive solid risk decisions.
Check it out:

Like this infographic? Share it with your network on Twitter, LinkedIn or Facebook.
Read the White Paper


