From Data Chaos to Clarity: How Connected Data Can Improve US Government Decision-Making

RVP, Federal Sales, Neo4j
6 min read

All of us – no matter where we are in the world – interact with government services. Whether it’s getting a driver’s license, seeking medical care, or accessing social security, government agencies play a central role in our lives. Despite holding a tremendous amount of critical data, governments often find themselves in a state of data chaos.
Data chaos. Two words with massive implications for US government decision-makers.
Data chaos isn’t about lacking access to information; it’s about the inability to connect it. Government agencies collect vast amounts of data daily, but it’s often trapped in incompatible, disconnected, or siloed systems.
This fragmentation leaves leaders making critical decisions based on an incomplete picture. The real issue isn’t the absence of data; it’s the failure to integrate and connect it effectively.
Graph databases can enable a profound shift from reactive to proactive decision-making. By connecting disparate data points, graph databases reveal hidden relationships and patterns, empowering government agencies to make informed decisions swiftly and accurately.
Graph Databases Turn Chaos Into Clarity
Data chaos is the result of decades of siloed data stored across disparate government agencies. Think of each database as a simple spreadsheet. These are great for storing data in a structured, table-based format, but are notoriously flawed when it comes to showing how different pieces of data are related to each other. Across an entire administration, this lack of connectivity scales to a massive problem.
Instead of rows and columns, a graph database is built on nodes – like people, agencies, or events – and the relationships between them.
A traditional database can tell you if a relationship exists, but a graph database can tell you how and why it exists.
A graph database reveals the patterns and dependencies that define how the real world works – through a network of related data.
Graph databases allow us to ask more complex questions of our data systems and find answers that were previously hidden.
Data Chaos in Action
A perfect, and unfortunately painful, example of data chaos in our world comes from the Paycheck Protection Program (PPP). During and after COVID, the PPP was designed to help small businesses keep their workforces employed during the pandemic’s economic downturn.
However, billions of dollars were lost to fraud as false companies were created, and applied for relief funds, before shutting down days later. A connected view of data would have enabled the government to quickly spot and tie together these fraudulent applications.
A graph database, for example, could have revealed in real time that multiple applicants shared the same phone number, IP address, or even a tax ID with a recently dissolved company. Traditional systems miss these insights because the data isn’t linked in a way that makes such hidden patterns obvious.
Enabling Data Analysis at the Speed of Thought
This allows for what I call a “continuum of thought,” where an insight drives the next inquiry, which drives the next, and so on. This is exactly how the human mind works, and it allows for a much deeper and more intuitive exploration of data.
Think about a classic police procedural drama. The detectives have a corkboard covered with pictures of suspects, locations, and evidence. They use strings between all the pictures to show how everything is connected.
The corkboard is a perfect (albeit analog) representation of a graph. It makes complex, non-obvious patterns immediately visible.
Graph databases do this on a massive scale, in real time, allowing government agencies to identify hidden insights.
Shifting Ways of Working From Reactive to Proactive
The time to modernize government data systems is now, and several factors converge to make this a “now or never” moment.
The primary driver is the sheer volume of data generated – it’s simply too much for traditional relational systems to manage effectively.
Even as AI enables unprecedented speed and scale in handling data—and falling storage costs allow organizations to amass vast amounts of data—they still struggle to unlock timely intelligence without tools such as knowledge graphs to organize, connect, and surface meaning from that information.
Finally, the internet has conditioned us to expect instant gratification. Citizens today are not willing to wait weeks for a government service when their favorite app delivers results in seconds. To meet these expectations, government agencies must be able to move with greater speed and agility.
Graph databases allow for 100x faster performance than relational databases for deep queries, turning what used to be a week-long research project into a millisecond-long query. Speed enables a shift from a reactive to a proactive stance.
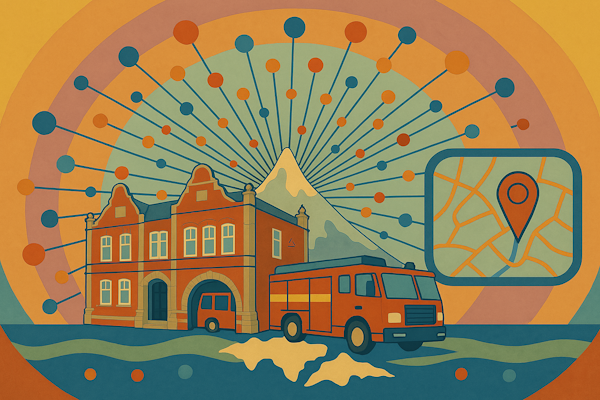
Take an example of a hurricane. When a storm is approaching, government agencies must quickly assess their readiness for a potential crisis. A traditional data system might show where their relief supplies are stored, but it stops there. With a graph, those agencies could gain a comprehensive, real-time view of readiness. The graph might show where personnel are located, what their training and specializations are, what equipment is available, and what the dependencies are in the supply chain to get people and parts where they need to go.
By connecting disparate data points, a graph gives leaders the ability to predict, plan, and respond with speed and a level of effectiveness once thought impossible.
Start Small, Stay Secure, Focus on Your People
Transitioning to modern data systems presents a unique set of challenges. Often, the most significant hurdles aren’t technical, but at the cultural and organizational level. Neo4j helps government agencies overcome these obstacles with a proven, guided approach.
Data Ownership: The most common challenge is the politics of data ownership. Different agencies and departments don’t want to share their data because it represents their power and control. Graph technology requires a fundamental shift in this mindset, encouraging collaboration over competition. We help agencies overcome this by starting with small, high-impact projects that demonstrate the power of connected data, then build a compelling vision for what’s possible.
Security Focus: For decades, security was built around the concept of a single, siloed system. Now, by connecting everything, a graph database creates a larger attack surface. This means security can no longer be an afterthought; it must be a native part of the graph itself. This requires new, more granular access controls that protect data both at the node level and along every relationship – requiring careful planning.
Workforce Training: Graph databases are fundamentally different, and a workforce trained on legacy relational systems needs to be upskilled. This isn’t just about training data scientists; it’s about retooling an entire organization to think in terms of networks and relationships. We address this through training and support, helping teams develop the skills they need.
Navigating Through Change Toward Mission Success
It’s imperative that government agencies evolve to keep up with the speed at which the world is changing.
Data lies at the heart of any agency’s understanding of its citizens, and graph databases help bring order to that data.
By breaking down silos, revealing hidden relationships, and accelerating decision-making, graph databases enable government agencies to become more intelligent, efficient, responsive, and proactive.
Ready to transform government decision‑making?
Share Article


Explore
Related Articles
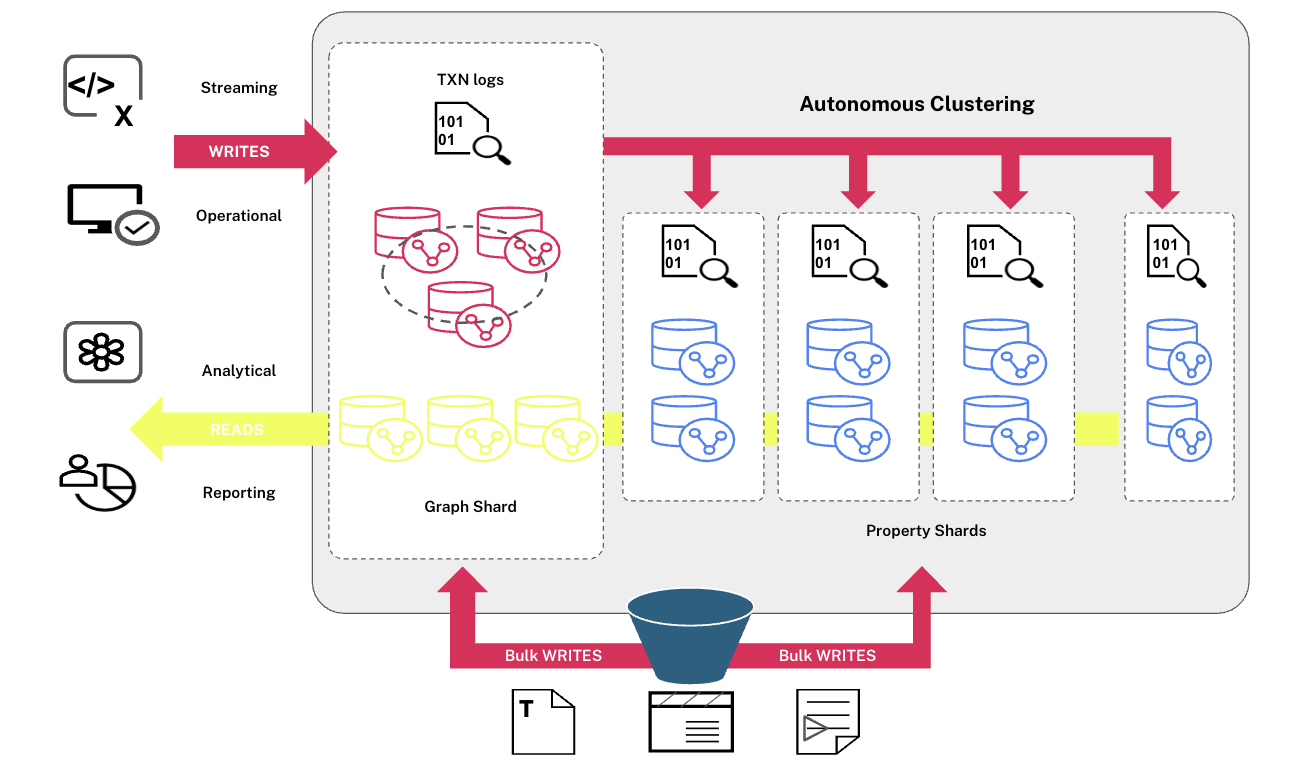
Property Sharding in Infinigraph: Smarter Scaling for Rich Graph Databases
Neo4j Launches Breakthrough Architecture to Unify Transactional and Operational Workloads

How Graph-Powered Supply Chain Improves Sustainability
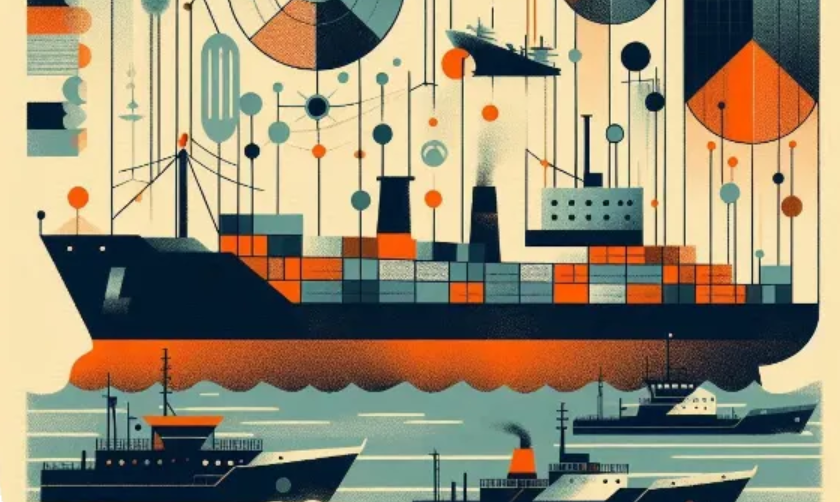
Exploring Neo4j Spatial: Path Intersections Using AIS Data
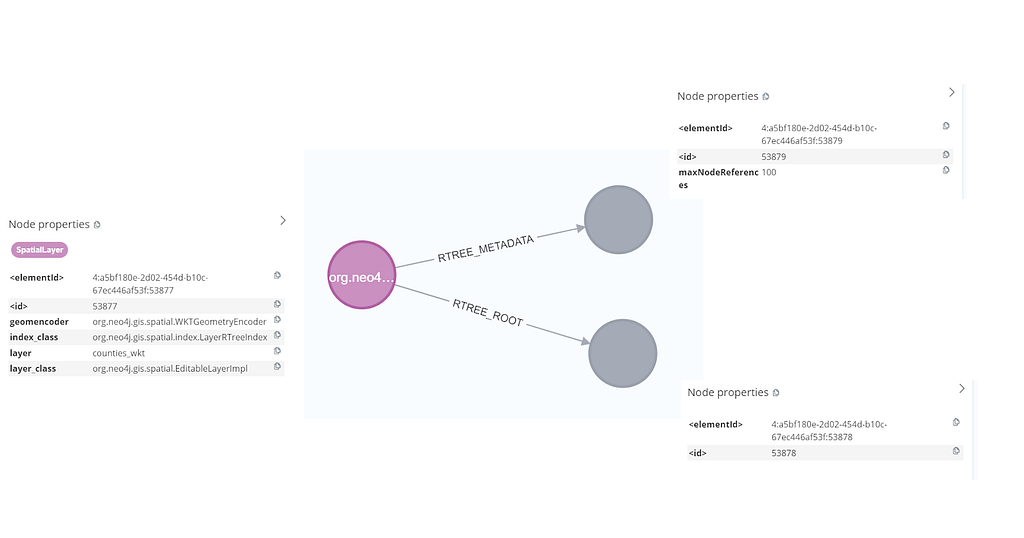
Exploring Neo4j Spatial: Layer Management, Spatial Filtering, and Intersection