Integrating Diverse Healthcare Data using MongoDB and Neo4j

Chief Architect, Zephyr Health
11 min read
Editor’s Note: Last October at GraphConnect San Francisco, Dr. Mahesh Chaudhari – Chief Architect at Zephyr Health – delivered this presentation on how to integrate diverse healthcare data using MongoDB and Neo4j.
For more videos from GraphConnect SF and to register for GraphConnect Europe, check out graphconnect.com.
At Zephyr Health, we are integrating diverse healthcare data by using two databases: MongoDB and Neo4j. Our database does many positive and powerful things with data, including connecting patients to the healthcare treatments and therapies they most need.
Below I’ll go over the architecture of Zephyr’s platform, the problems we encountered and addressed while building our comprehensive platform, how different profiles appear in both MongoDB and Neo4j and the invaluable lessons we learned along the way.
Zephyr Health
Zephyr Health takes healthcare data from pharmaceutical companies and transforms it into information. This allows us to derive real-time analytics that help patients connect with different therapies and pharmaceutical companies connect with different healthcare providers.
Founded in 2011, we have over 100 employees in the U.S., Europe and Asia. We are backed by KPCB, Icon Ventures and Google Ventures, and we work with a number of clients — primarily pharmaceutical companies — within the U.S. and Europe.
Emerging Healthcare Data Challenges
There are a number of challenges faced by the pharmaceutical industry today. More doctors and hospitals are moving away from generic therapies in favor of precision medicine, a form of treatment that requires a lot of information on the part of pharmaceutical companies in order to be successful. These companies need to know what clinical trials are being conducted and who the key opinion leaders are in order to connect them to the products these companies are going to launch.
Consider the following (fictitious) example: Leslie Johnson at GlaxoSmithKline wants to launch a drug that treats asthma. She has an extensive amount of data available, including information from both CRM systems and Salesforce that includes RMS data, prescription information and doctor and hospital network information. While she has all this data, she is only able to look at it in a very disconnected way.
Leslie wants to know who the clear opinion leaders are right now. She knows who they were in the past because of her institutional knowledge, but based on the information that is presently available to her, she isn’t able to identify the emerging leaders.
Zephyr allows her to take the data from all the different places it’s stored and integrate it into one data platform. Now she can identify key opinion leaders, emerging doctors for a specific therapy and the best hospitals and referrals to contact.
We’ll use the following example throughout this blog post to illustrate how Zephyr can integrate unstructured heterogeneous data to help Leslie distribute her new life-saving drugs to the best people and places.
In this example, we have data for the doctors Tom and Ray.
The first column, NPI (National Provider Identifier), is a unique identifying number for doctors similar to a social security number. We also have data for the doctor’s’ first name, last name and specialty. As we get more data, the unique NPI number allows us to connect different doctors to different clinical trials and publications.
This example data points us to a number of questions:
How can we answer all of these questions with one platform? Building a more generic platform to cover all these different domains is rather difficult. It needs to be flexible, extensible and adaptive, but it can’t be too cumbersome or complex to maintain or use.
To address this, at Zephyr, we started using something called ontology.
Ontology-Driven Data Integration Platform
Ontology is essentially a formal representation of a specific domain and contains a vocabulary. This vocabulary includes the definitions of all the different entities that exist in our domain, along with the entities’ attributes and the relationships that exist between them.
It also includes a taxonomy based on all the information you have in your vocabulary. Ontology drives Zephyr’s data platform and helps us integrate unknown and unseen data in a more consistent way.
Vocabulary
In the pharmaceutical world, your entities include doctors, hospitals, patients, medications, medication side effects, clinical trials, etc. With each entity, you also have data points, or organic attributes, which are unprocessed raw data coming from outside client or public data sources. This includes specific doctor information such as first name, last name, specialty, address and associated institution.
But having organic data or attributes isn’t enough; you need to create more analogies. We created data from the data points, which we called derived information, which essentially takes the existing data and creates more information.
A good example of this is sales data, in which you take monthly sales data and turn it into quarterly and yearly projections – which means you’re integrating a lot of information.
Finally, there are entity relationships, which are very important. For example, we want to know which representatives, hospitals, etc. a certain doctor is connected to. How do we define that information? We can allow our system to build whatever relationships it finds, or we can be very specific by requesting only doctors connected to certain hospitals.
We started building this vocabulary in 2011, and we’re still building it. As more and more data comes in, our vocabulary has to be self-evolving so that it can handle new types of information, and have the ability to take unseen data and automatically build out the vocabulary.
Vocabulary Storage
Where and how do we store this vocabulary and data? We explored a number of different options, including relational databases and NoSQL tools.
Relational databases have strict schemas, and while NoSQL stores are technically schema-less, the program still needs to understand how the data is organized.
With relational databases, the more hardware you have available, the better performance you get. If you run out of hardware, you can start making clusters, begin charting or create an application to improve your performance. You can increase the performance of NoSQL stores by using applications and charting through Cassandra, HBase, MongoDB and Neo4j applications.
In relational databases, you are able to use a large number of clusters for relational work, but you also have to use a large number of JOINs in order to respond to queries, which slows down your database. You can add more indexes, create materialized views and define more data points — but you may only reduce 20 joins to 15.
With NoSQL stores, you have to look at the different scenarios and use cases to determine which are best to solve your problems. For example, Cassandra, Neo4j and MongoDB are all very good for different functions.
Adopting Polyglot Persistence
For Zephyr, we knew that no one single database would be sufficient for all of our use cases, so we chose two in a polyglot persistence database: MongoDB and Neo4j. MongoDB is our document store, which holds all the wholistic profile information for each doctor.
There are a number of strengths of MongoDB: the JSON format supports temporary indexes and strict consistencies; MapReduce capabilities are continually improving; and queries are very powerful, albeit difficult to write. However, there are no JOINs. These can be mimicked by passing IDs, but it’s still very cumbersome.
Neo4j helps address most of MongoDB’s limitations because it allows us to easily build both explicit and inferred relationships. Because it’s a heavy index database, performance is very consistent whether you’re working with a few thousand nodes or a few million.
If you’re thinking about throwing more hardware at your relational data sources, you might as well throw more hardware at Neo4j and keep everything in your memory. Up until now, all of our graphs — even 40 million nodes with two billion relationships — fits in our RAM.
Zephyr uses MongoDB and Neo4j in the following ways:
All the data points go into MongoDB, while a subset of the data goes into Neo4j, because we don’t need all the data points for every doctor or entity. All we need are some key points in our graph database so we can do “slice and dice” queries. Once we have your subset of those entities, we can go to MongoDB to pull all the information about those entities.
Zephyr Health Platform Architecture
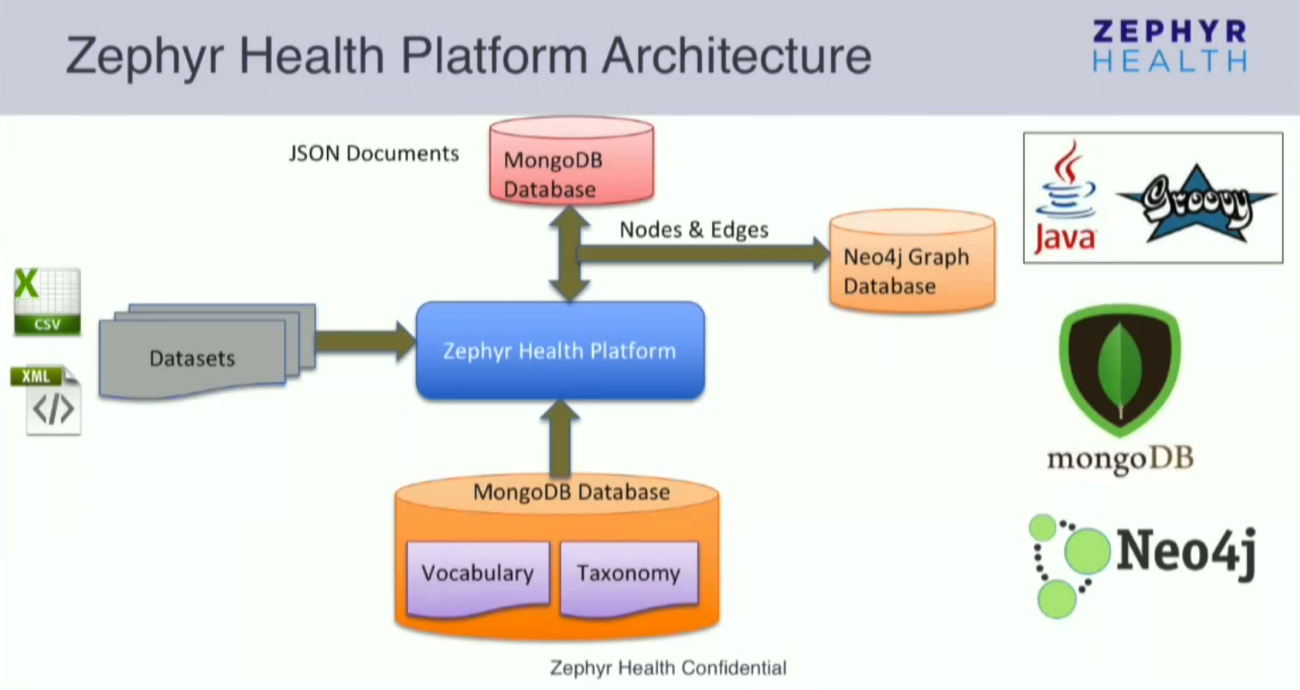
Our platform was written from scratch in Java and Groovy. The platform derives itself through the vocabulary, taxonomy and ontology, which we sewed into MongoDB. It’s easy to read the whole vocabulary or taxonomy from MongoDB; you don’t have to do anything to make the platform understand the vocabulary.
Typical datasets are sent to the system as XML or CSV files via Dropbox or Box, and we are constantly adding more connectors that allow us to import data. Once the data is uploaded, a number of transformations occur.
For example, the system automatically standardizes and normalizes values such as the names of medical specialties (for example, cardiologist vs. cardiology) and the addresses for hospitals and doctors (the platform reaches out to different address services to standardize the data).
We also start building relationships through the exact match. For example, the NPI number helps us connect entities because each doctor has a unique ID. But what if we come across doctors named Tom and Tommy? Are they the same person? Tom works at Stanford Medical Center, while Tommy was in a clinical trial at that center.
How can we determine if these are the same people? The platform uses fuzzy match logic to make an educated guess about how closely these to people are related, and then lets us combine those entities.
While it is performing these queries, it stores the documents and profiles as JSON documents in MongoDB. At the same time, it also starts pushing data into the Neo4j graph database as nodes and edges.
The number of nodes or attributes that go in the graph database are controlled through the vocabulary and ontology. MongoDB and Neo4j are kept in sync so that any time there are changes to data in MongoDB, it will be automatically updated in Neo4j as well, and vice versa.
Below is a very high-level classification of the data. A full profile typically contains the main profile along with an identity section, which is similar to a business card type view and has very few key attributes. All the other data points go into the attribute sections.
We have a separate document for entity relationships, which are stored in both MongoDB and Neo4j. Our applications also determine where different entities are located in terms of address, and if more than one address comes up, it also determines which is the most accurate.
The vocabulary and ontology helps us ingest the data into our databases. Sometimes our clients have questions about why and how we made certain connections between different data points. Attribute references allow us to go back through the lineage and determine how we found the different relationships.
An Example: Doctor Tom
Continuing with our Tom example: Once his information has been ingested, his profile will look something like the diagram below. There is a much larger amount of metadata involved in the document than would fit on the slide, but the general structure is still the same.
MongoDB assigns an ID, and there are sections for identity and attribute. We can control which attributes go into the identity section and continue to make changes.
But how does this profile look in Neo4j? Below, the dark node at the center is the entity — Tom — while the light grey nodes that revolve around it are Tom’s four aggregate nodes.
Now we are going to add the clinical trial and any associated trial information into the platform, which understands the NPI number. Because the NPI numbers are exactly the same, it’s going to add the trial to Tom’s profile, which leads the document to evolve.
As you can see below, the identity section remains the same but the attribute section expanded with added information from the new dataset.
In the graph, the platform checks to see if the particular attribute already exists in the system; if not, it will create a new node. Below, new nodes have popped up for institutions, and the clinical trial start and end dates.
But how does this help us answer the questions we started with, all of which relate to how flexible our platform is? We’ve shown that this platform is flexible because Tom’s profile contains all his information; the documents exist in the same collection, and we don’t have to build a different collection to account for new data points.
It is extensible and adaptive because the system evolves to account for new vocabulary. The system makes the vocabulary richer, accommodates new attributes and entities, and data is available automatically and immediately to our applications.
Zephyr’s Current Data Challenges
Over the last three or four years since we built this data platform, we’ve learned a lot.
We learned that no one single database was going to work for all use cases, so we embraced polyglot persistence. While we started with a more generic platform, we started putting more effort into building specialized algorithms to populate our data more intelligently.
Ontology-driven development has proven very powerful for Zephyr, but we still have some challenges related to data modeling and organization.
One of the main challenges we continually face is indexing. How do you index something you’ve never seen before? As the profiles get bigger, we approach MongoDB’s 60MB size limit for each document, which poses another huge challenge.
If we reach that limit, we essentially have to start the data modeling and organizing over again, and then tweak the system so it will understand that all different pieces go into different collections.
Watch below for a glimpse of what our applications can do with Neo4j:
Neo4j and New Healthcare Relationships
In the below graph, the purple node is a healthcare provider and the bluish node is the institution entity node. Our graph helps us figure out the relationships between our different entities.
When you click on that institution node, the graph just explodes, which gives us more insight. The green node below is the client representative, which is connected to the same (dark blue) institution.
If you click again on the green client rep node, a number of new relationships pop up. You can see that the rep is not only connected to the dark blue institution node, but it is also connected to a number of other institutions and hospitals.
This is where Neo4j plays a vital role in healthcare; it helps you explore relationships that you have never seen before. And you don’t have to go through a number of JOINs to find them; they can be bared in one single hop in the graph database.
Summary and Demo
In the healthcare field, there is a lot of disconnected data that we need to bring together in order to determine relationships. We have embraced a generic entity-attribute-value (EAV) model and looked at prescription data, claims data, network influence, CRM data and Salesforce data, all of which fits well into this model.
We focused on data integration through specialized algorithms that make sense of the data, we’ve split storage with documents that provide a 360-degree view of the profile, and we use Neo4j as the query mechanism for determining relationships.
Standards are incredibly important for graph databases, and as a community we can hopefully come up with Cypher as the standard for graph databases. It’s also important to come together and build a standard vocabulary for the pharmaceutical and healthcare world.
In the healthcare domain, data has been and will continue to keep changing. And we have to make decisions today based on the data we have.
Inspired by Mahesh’s talk? Register for GraphConnect Europe on April 26, 2016 at for more industry-leading presentations and workshops on the evolving world of graph database technology.


