How DBS Connect Knowledge with a Knowledge Quotient Framework

Vice President, APAC Marketing
6 min read
Editor’s Note: This fireside chat with Anand Sundarraman is from GraphSummit 2022.
During Neo4j’s inaugural GraphSummit, we had the pleasure of hosting partners and customers to share insights and stories behind their connected data experiences. We will be featuring more of them in this series of blogs – so watch this space for more recaps. For the sixth presentation in the series, we’re sharing a highlight from the Singapore stop of the tour. In this fireside chat with Anand Sundarraman, Senior Vice President of DBS Bank, we will discuss his journey on how DBS brought their siloed customer data together using knowledge graphs to achieve customer 360.
Enjoy! And for more information, please write to me at daniel.ng@neo4j.com.

Robin: We have the privilege of having Anand on stage to share his experience implementing knowledge graphs in DBS. DBS is recognized as a leader in digital transformation and your CEO, Piyush Gupta once said that DBS acts less like a bank and more like a tech company. Can you share with us how your team decided to embark on the knowledge graph initiative?
Anand: As you said, we believe we are more of a tech company than a bank. Our latest tagline is “Live more, bank less.” So we started investing a lot in bringing a lot of our data together and built a data platform. Typically, it’s very hard for a bank because each of our systems operates in different silos. So the first step was to bring all those data together. It allowed us to do reporting easily, dash-boarding maybe, but it didn’t give us deep insights. So that’s where graph databases and knowledge graphs come in. Now we’re able to not only answer some predefined questions but also answer much more sophisticated questions with much deeper insights.
Robin: Right. You are now able to answer more sophisticated questions. All of us here want to answer more sophisticated questions and not just predefined questions. Anand, can you explain how we can answer sophisticated questions using a knowledge graph?
Anand: So broadly three points. First, we have tried to automate some of the steps our bankers do manually today, be it market analysis, credit analysis, or financial analysis. So those steps were modeled using knowledge graphs. On top of the data, we have also used semantics and ontologies, which help us to automate some of those steps. We are able to derive deep insights by bringing all this data together. Lastly, what we are also doing is we are also looking at a lot of data science algorithms that Dr. Alicia was talking about.
Robin: Would you be able to share some examples of the type of specific insights that the knowledge graph has brought to this whole client relationship and engagement journey?
Anand: Typically we have thousands of customers across various locations as a large bank, be it corporate customers or consumer areas. As I mentioned earlier, we have brought all this data together, including all their application data, transaction data, where they’re doing payments, and what they’re buying, for example. We have a lot of external data as well, be it bureau data or ACRA data in Singapore.
By bringing all this data together, we can form a very good customer 360, a full view of the customer. Then we can identify the products that we can potentially sell to this customer, based on their transaction patterns, buying patterns, or the kinds of credit cards they have applied for.
We can recommend some of our products to these customers. And then on the corporate side, we can start looking at our customers’ buyers/suppliers. If we have an existing customer, who are these customers transacting with? Where are they buying from? Who are they selling to? Can those suppliers or vendors be potential customers for us? Or in companies that have directors and shareholders, is there a particular concentration of a certain kind of directors or shareholders? Or do we have a certain concentration risk around certain industries or even geography? So these are the kind of steps that enables us to connect with our customers better.
Robin: Great insights Anand. And I know that we talk about this term called “knowledge graph,” and you have actually termed this project internally as a “knowledge quotient.” So can you share a little bit about how you came up with this term?
Anand: Internally we’re trying to represent some of the knowledge that we have in our bankers’ heads. So there is a lot of decision that our relationship managers or bankers have to do day to day. For example, say they do industry analysis or market analysis, we are looking at a way to represent such real-world information. That’s how we use the knowledge graph.
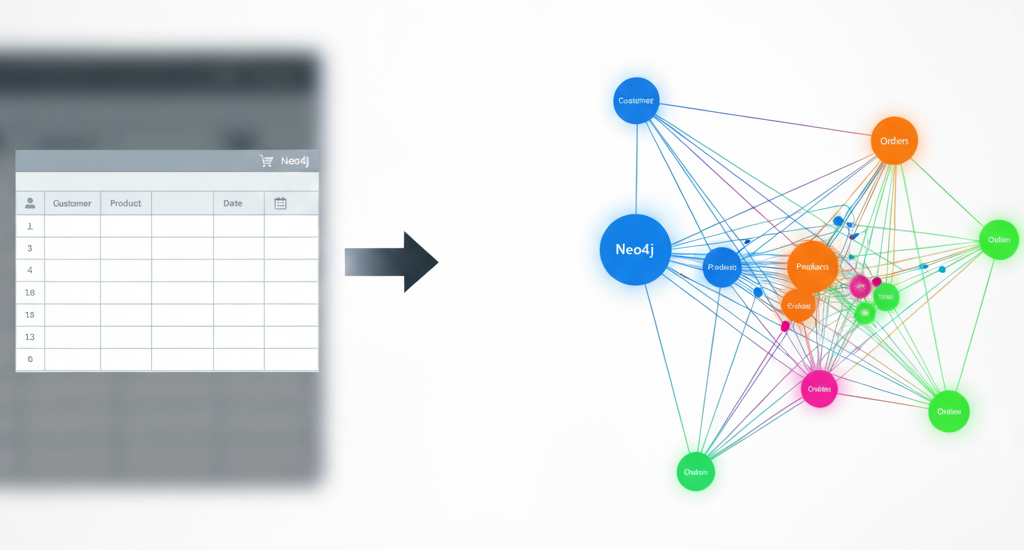
Of course, we can try to represent this using a relational database, but that’s just tables and columns or documents. It doesn’t allow for the relationship to expand. By representing it as a knowledge graph, we are able to expand as the relationship grows and as the need arises. It also allows us to discuss our relationship with users. It’s much more intuitive; it’s like drawing on a board. It’s like a mind map or it’s like drawing on a whiteboard. So we call it a “knowledge quotient” internally, and we are using it across different use cases.
Robin: That’s really interesting because I know intelligence quotient, IQ. And that is where graphs think like your brain, like a neuro network; and relational databases are not designed for this type of deep connection. Interesting.
Back to your earlier point about graph data science, I know you started this knowledge graph with Neo4j Graph Database and enhanced that knowledge graph with graph algorithms and data science. What are the key reasons that you decided to explore graph data science (GDS) and what are the initial benefits that it has brought to this knowledge portion so far?
Anand: As we brought the data together, we wanted to, especially in the fraud area, see how all the payment and buyer/supplier data interact or how the transaction flows. So we started running pathfinding, clustering, and community detection algorithms. We didn’t have to write programs; we just had to call the GDS libraries, and it was very easy to use for our data scientists and developers. We could almost get the outputs of these algorithms very easily. We are still experimenting in this area, but we see its power and it seems very promising.
Robin: That’s awesome. Last question: there are audiences here who come from diverse organizations and industries, what would be your advice for them when they consider embarking on the graph journey and how can they get started?
Anand: Okay, interesting. So maybe a few points. So we have heard a lot about graph databases, and they’re here to stay. It’s just a matter of when you adopt. We want to be the Google of search engines or the Netflix of all these streaming services. If you want to be ahead, start with knowledge graphs.
A similar question came up when talking to Dr. Alicia Frame as well, and her point was to start with something small, some experiment, a specific use case, and then slowly it’ll expand. So I’m sure whoever has started using graph databases will agree. We start with one specific use case or one specific problem to solve. From there it just, you’ll see the power of graph databases and it’ll expand from there.
Robin: Wonderful, Anand. Thank you very much for your time.
Get the Free White Paper


