Graph databases are the fastest growing database technology. Some people are drawn to graph databases for technical or performance reasons; others become interested because of the intuitive data model.
One thing is clear: Graphs represent a departure from the relational and NoSQL models, but this departure is inherently worthwhile.
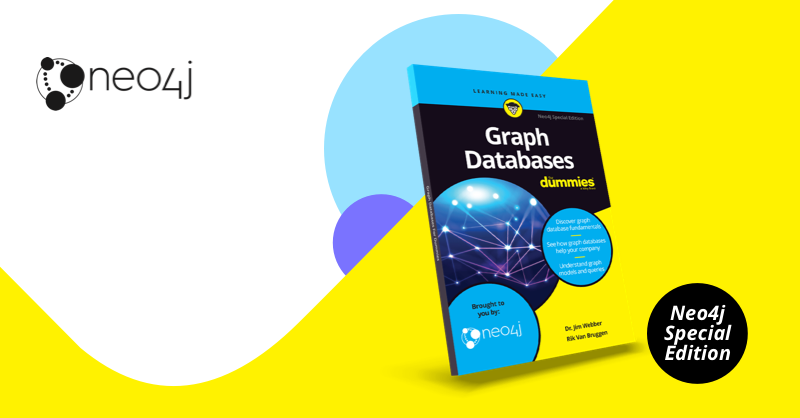
Graph Databases For Dummies, Neo4j Special Edition is all about getting started with graph databases. We remember what it was like for us learning about Neo4j and graphs, and thought hard about the book we would have liked back then. With this book, we want to give everyone the basics so they can get started quickly and confidently. There’s no bewildering mathematics or coding, just practical advice from people who’ve trodden this path before.
This blog extracts some main highlights of Chapter 1 – the fundamental graph database building blocks – as a convenient sample of what to expect from the book.
Introducing Graph Databases
Since the turn of the century, an explosion of new database technologies has ended the prior dominance of relational systems. These various new kinds of databases distinguished themselves with the umbrella term NoSQL. While the terminology is debatable, NoSQL technology really is different from the relational world. Instead of storing data in rows in tables, databases store nested documents, key-value pairs or columnar form data.
There are good reasons for the emergence of new data models. Document databases optimize for ease of storage and retrieval with a file cabinet metaphor of document-in, document-out. Column store databases optimize for scale and the ability to scan many records rapidly. In optimizing for their use cases though, the new databases opted for simplistic data models. For example, understanding how two records are related is part of the relational model via joins, but no equivalent mechanism exists in document, key-value or column store databases.
Exploring Graph Database Basics
A graph database uses highly inter-linked data structures built from nodes, relationships, and properties. In turn, these graph structures support sophisticated, semantically rich queries at scale.
graph database turn NoSQL thinking on its head: Relationships between data are just as important as the data itself.
A graph database builds a network of interconnected entities to represent its domain. Like relational databases, you can query that model to gain insight, but unlike relational databases, the data model is intuitive.
With a handful of simple tools, you can build expressive and understandable data models that are highly performant.
Understanding Who Uses Graph Databases and Why
Graph databases are general-purpose data technology. They can be used by a wide variety of domains, from healthcare to finance, and energy to disaster response. The key to understanding when to use a graph database is the value of links. If your data is connected, whether it supports an online mobile app or an offline machine learning framework, then a graph is going to be a good choice.
Seeing the Benefits of Graph Databases
Graphs bring several benefits across the whole life cycle of a system. For the production lifetime of a system, graphs offer superior querying of complex models, enabling business to ask pertinent questions with high performance. Graphs also offer ease of development, where combining simple patterns allows you to build large sophisticated networks that represent your problem domain in high-fidelity.
Explaining Labeled Property Graphs
The most widely used model for graph databases is the labeled property graph model. To experts, this shorthand is useful to distinguish between this model and other more mathematically inclined models, such as hypergraphs. But if you aren’t an expert, this description may need a little unpacking.
The fundamental components of the labeled property graph model are nodes and relationships (you may also know these as vertices and edges) and constraints.
Remember!
In the labeled property graph model, we use naming conventions to distinguish elements at a glance. The following helps describe the naming conventions:
- Node labels are PascalCase. Every word starts with an uppercase letter with no spaces.
- Relationships are SNAKE_CASE_ALL_CAPS. Replace all the spaces with an underlined character and convert all the letters to capitals.
- Properties on nodes and relationships are snake_case. Replace all spaces with an underlined character and lowercase all the words.
Defining Nodes
A node typically represents some entity, such as a person, product, electrical junction, mouse click or patient diagnosis. You can optionally add labels to a node, which indicates the node’s role in the graph. For example, you could label a node representing a corporate customer as Business and Customer, while labeling a private individual as a Person and Customer. With these labels, you can easily find all customers, all individual customers, or all business customers and use them as starting points in graph queries. (Graph queries are covered in Chapter 4.)
You can add data properties to nodes. For example, you could add first_name and last_name properties to a node labeled Person or add an invoice_address property to a node labeled Business.
Explaining Relationships
To link nodes together, you use relationships. Relationships are singly-typed, directed and can optionally have properties attached to them. The type of a relationship provides a predicate (for example, MANAGES) while the direction of the relationship shows the subject and object (for example, Rosa manages Karl, not the other way around).
Any number of relationships of any type, in any direction can be attached to a node. Some nodes are sparsely connected, some densely. This distribution is quite normal, and the model allows for infinite variation.
Enforcing Constraints
After you have the basic structures in place, you may want to structure how the graph evolves. By declaring constraints, you can ask the database to enforce that certain properties must be present for certain node labels or relationship types – for example, that first_name and last_name must be present on nodes with Person labels or a power_rating must be present on POWER_LINE relationships. You can also ask the database to ensure that fields are unique when adding a Social Security Number (SSN) to Person nodes, for example.
Unlike traditional databases where an up-front schema is required, we like to take the approach that data should grow organically where it can, and be constrained where it must. This approach gives both flexibility and good governance.
Climbing the Graph Learning Curve
In a graph database, nodes can be connected by any number and type of relationship in any direction. You can use as many or as few as needed to model the domain accurately. There is no normalized form to which you must adhere: If many paths between two nodes exist, that’s quite normal, just like in real life.
In a graph database, each node represents a single entity and each relationship joins two specific nodes. That means if you have a lot of products to store in the database, there will be a lot of product nodes, and if you have a lot of customers for those products, there will be a lot of relationships linking them together.
Initially, the instance-oriented view of data in graph databases seems messy. After all, a relational database collects all similar data items into their own tables and permits joins between those tables. This seems to keep complexity down, in principle. But graph databases also have abstractions that can help minimize complexity.
Entity-relationship diagrams from the relational world often make good design diagrams for labeled nodes and their connections in a graph model. If you can draw an Entity Relationship Diagram (ERD) to model a relational database, you can create a graph data model.
In practice, graphs are simpler than relational models. Over time, thinking in graphs becomes quite natural. We found that overwhelmingly the hardest part is letting go of relational modeling and trusting that a network of nodes and relationships can be
even better.
Going All-In on Graphs
Graphs are simple to build and highly expressive, so we think you should be using them everywhere. Well, perhaps eventually, but in today’s environment, there are places where other databases are a better choice. That might seem strange coming from graph aficionados, but we think graphs follow the 80-20 rule. They’re great for 80 percent of tasks because they’re a general-purpose database, and they’re not directly helpful for 20 percent of the tasks that have specialized needs.
But sometimes graphs can be helpful for that 20 percent, too. As an example, imagine you have a bulk storage system. It may be a data lake or perhaps an object store like Amazon’s S3. These storage systems work for storing large amounts of items, but they’re not great systems for reasoning about data. The data model simply doesn’t care about connections; it cares about volume.
In this case, graph databases can be used as the index over the bulk store. The graph can be used to link together related items to provide curated views of the underlying items. You don’t have any more of those intensive batch processing jobs needed just to find linkage between records; just search paths in the graph in real time, and then
go down to bulk storage to pick out only those records you need. Adding graphs to bulk storage systems adds value.
Conclusion
Throughout this book we use the Neo4j graph database for all our examples. You can run those examples, too, after downloading the Neo4j desktop app, which you can also use to build your own graph-based applications.
We hope you feel right at home and are able to find what you’re looking for as quickly as possible. We hope you finish reading this book with a basic understanding of how to apply graphs to a handful of use cases and with enthusiasm for the technology.
Happy Reading,
Jim Webber & Rik Van Bruggen


