Machine Learning Algorithms
10 min read
Editor’s Note: This presentation was given by Lauren Shin at GraphConnect New York City in September 2018.
Presentation Summary
Lauren Shin is a developer relations intern with Neo4j and a student at UC Berkeley.
In her presentation, Shin briefly introduces the concept of machine learning. To those who may be wary of a robot takeover, machine learning is an application of statistics so that machines are able to learn with data. The majority of this is data cleansing and a lot of math.
Next, Shin breaks down differences between human and machine learning and explains how the addition of machines can help humans solve problems faster and on a greater scale.
There are three approaches to better data analysis through machine learning that Shin covers. The first approach uses user-defined procedures with Cypher and Neo4j. Approach one includes creating a model, giving it a name, specifying classes that the item we are studying might belong to and then using those features to create a classification system.
Approach two covers more simplistic machine learning algorithms. This approach involves using a graph database to store and hold the data while the observer builds models. This process still being tinkered with to see how it could work for more complex algorithms.
Approach three uses graph structures to restrict the potential relevant data points. If you have all of your data stored in a graph, then you could restrict comparisons and make your run time feasible.
Model version control is a graph-related problem as well. You will come across several different versions of models that develop from each other. Representing all of these relationships within the graph help increase transparency in the process of building machine learning models.
The world of graph is always expanding and changing. There will always be new graph-base learning algorithms that will allow us to make insights we otherwise wouldn’t see. Graphs always offer a better way to express our data.
Full Presentation
Today’s talk will be about machine learning and graphs. My name is Lauren Shin, I am a developer relations intern at Neo4j, and a student at UC Berkeley.
Machine learning is an exciting topic right now. Everyone from our customers to community developers want to make more informed decisions with the data that they have. As part of the developer relations team, I always love to explore new topics that excite the developer community.
The rest of my team is really busy organizing events such as GraphConnect, providing user support, updating and maintaining the community site, writing super awesome blog posts, and so much more.
When I started working at Neo4j, I felt a little bit swept out to sea. There’s a lot going on here. I’m here to talk about a unique space which is machine learning and graphs, and even more specifically machine learning as implemented as procedures in Cypher, similar to the graph algorithms library.
To start off, what is machine learning?
What Is Machine Learning?
Machine learning is an application of statistics so that machines are able to learn with data. This is scary to some people who think that someday machines will get too powerful. But don’t worry, it’s all just data cleansing and a lot of math.
Machine learning algorithms such as neural networks and deep learning are really just a computationally exhausting amount of calculus that allows machines to do what humans do easily. Machines do not work as well as humans, but they do work at a greater scale.
Human Learning and Machine Learning
Let’s start off with a little bit of human learning. This is from the classic iris classification data set.

I had never actually taken a minute to think what a human would do to classify the fourth image.
Could anyone predict which class, versicolor, setosa or virginica, the fourth flower belongs to? I started panicking at first because I thought they all looked the same. Then I looked at enough Google images of iris flowers that they started to look different to me.

The answer is setosa.
When it comes to asking the question how could we train a machine to do this for us, we really need to start thinking about what quantitative differences in the flowers allowed us to classify the last image.
The iris flower has two main features which are the petal and sepal. In this case, we want to identify each flower with four quantitative measurements. The four are listed below.

Since this is a classification problem, logistic regression is the model that we want to use. Logistic regression assigns a weight to each known variable using known data points.
The logistic function F just takes the weighted combination of these values and maps it as a value in between zero and one. This is so the output of the logistic function could just be interpreted as a probability that a given flower belongs to that class.
For each known data point, you could think about the model taking little steps towards better and better predictions. In the case of the iris flowers you would create three models, one for each class. Once you have your models trained you would input an unknown flower’s data into all three models. Then you would say that the class the flower belongs to is the model with the highest output probability.
This takes us back to the question how does machine learning fit in with graphs? Before I started working at Neo4j, most of the actual incorporations of machine learning in graphs we had produced were just integrations with existing software.
In order to use these, you would export graph data in another software, run your analysis, and then take the model parameters that you created, and then import them back into the graph. This was great as it helped existing customers that might be asking questions about how to do this exact process.
However, since data is exported and brought back into the graph it doesn’t really take full advantage of the fact that when you use a graph database, your idea is you want it to store your data. Ideally, it would be able to store your data while you’re performing machine learning analysis.
This is the approach that a lot of industries use when they’re using machine learning and data science to solve their problems. They would dump their data from the day, analyze it overnight and then bring those decisions back into production the next day.
This past spring and summer my work was to extend our query language Cypher with user defined procedures. This was so that you could train models from the Neo4j browser while the data could remain in your graph.
I extended Cypher through user-defined procedures. These are written in Java, and then deployed to Neo4j as plugins.

After this they’re accessible from Cypher just like the graph algorithms library.
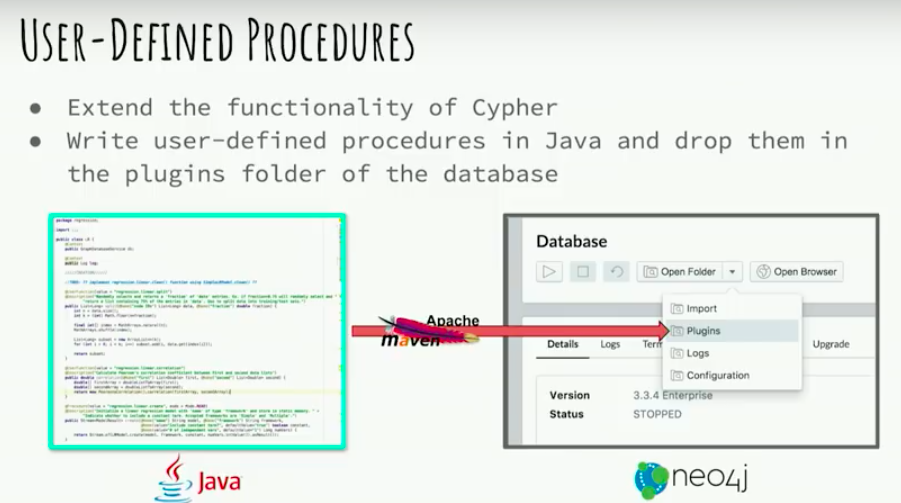
In this case, the models that you would create using this procedure would be stored in the static maps of the Java classes.
Approach 1: User-Defined Procedures
Let’s go back to our flowers. In fact, iris flowers produce in two ways, either through asexual reproduction or through the hybridization of two flowers. Let’s suppose that we have an iris flower breeding program, and then we input our flower data into the graph as mother and father relationships.
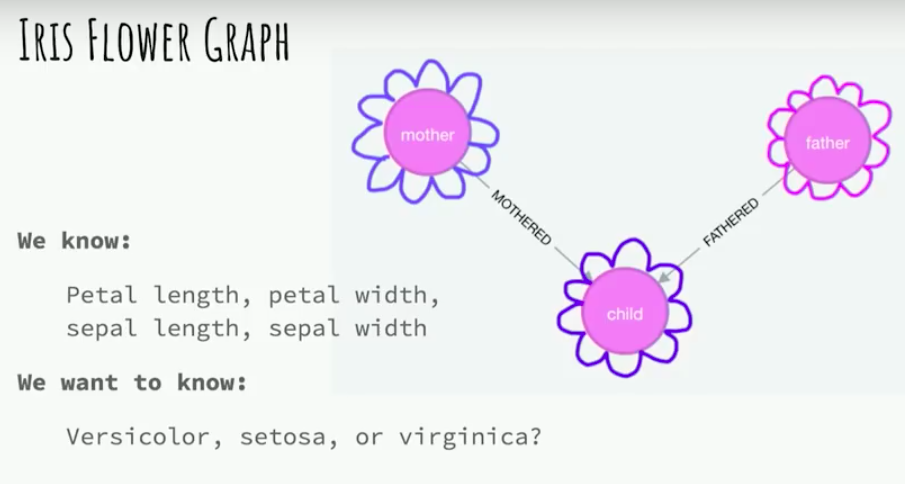
For some flowers, we don’t know which of the three classes they belong to. We’re given the four measurements from before. We want to keep our data in the graph and run user-defined procedures to create a logistic regression model.
Using the user-defined procedures would look something like below. This is just a Cypher screen capture from the Neo4j Browser, but you could also run these through a Py to Neo script as long as you’re using Cypher to interact with the database.
When we create our model we just need to give it a name, specify the three classes that the flower could belong to, and then specify which features we’re going to use to classify our flowers.
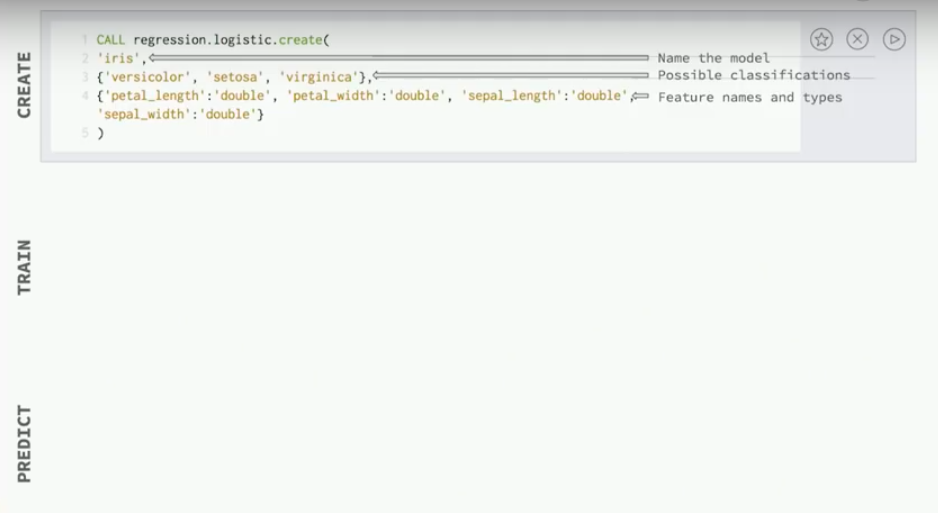
In this case, you need to say that those features are numeric by saying they’re going to be in double form.
Next, you query to find all iris flowers with known species, and then we add them to our model just by specifying which model we want to add them to. We ask what are the four feature names and values stored in the iris nodes, and then we find the correct classification.

Finally, to predict you could query for all flowers that don’t have a known species.
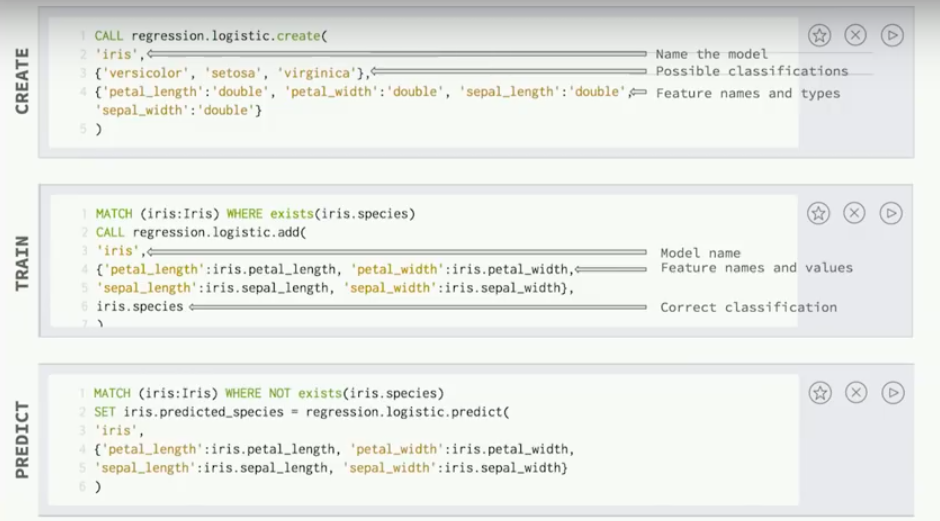
Say which model you want to use to predict the species, give the known feature values, and then the predicted species will be stored in the node.
Approach 2: Eliminating Data Export
This approach differs from previous approaches by eliminating the data export step. Graph databases store data so they should be able to hold data while we build models.
These procedures that I wrote only deal with one data point at a time. There’s no memory burden and they could be updated just as dynamically as the graph.
This is one of the most simplistic machine learning algorithms, and it’s still to be explored how this approach would work for more complex algorithms.
When thinking about how we could improve our approach we go back to the question where does machine learning fit in Neo4j? Were these procedures that I created the best use of graph databases in machine learning? How could graphs set Neo4j in the machine? How can graphs set Neo4j apart in the machine learning space?
This is the most straightforward approach. You could get the same performance benefits that you get for running your standard queries by running them in a graph database. You could get those same performance benefits when you’re trying to collect feature values to be input into a machine learning model.
If you wanted to find a user’s number of friends and use it to predict some other information about that user you could just query a constant time to find how many outgoing knows relationships are going out from that user node. If you were using a relational system that might take costly joins.
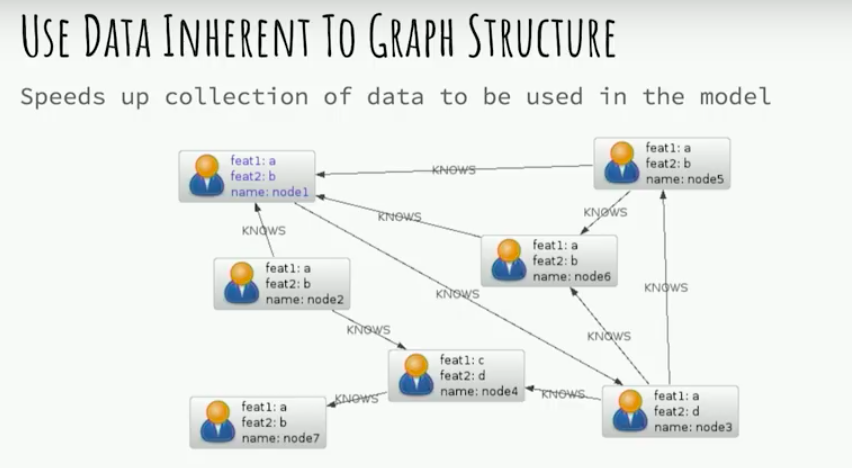
This would assist you in any sort of approach to machine learning with graphs, and it speeds up the building of your training data set.
Approach 3: Restrict Comparisons with Clustering
A more complex approach is using graph structures to restrict the potential relevant data points. For example, if you had a deduplication need where you have user fields from two different products. You want to find which users corresponded as the same user. If you were to make all possible comparisons that would be a Cartesian product which is very, very costly.
However, if you were to have your data stored in a graph, and then infer groups of similar users using the graph structure then that could restrict your comparisons and make your run-time feasible.
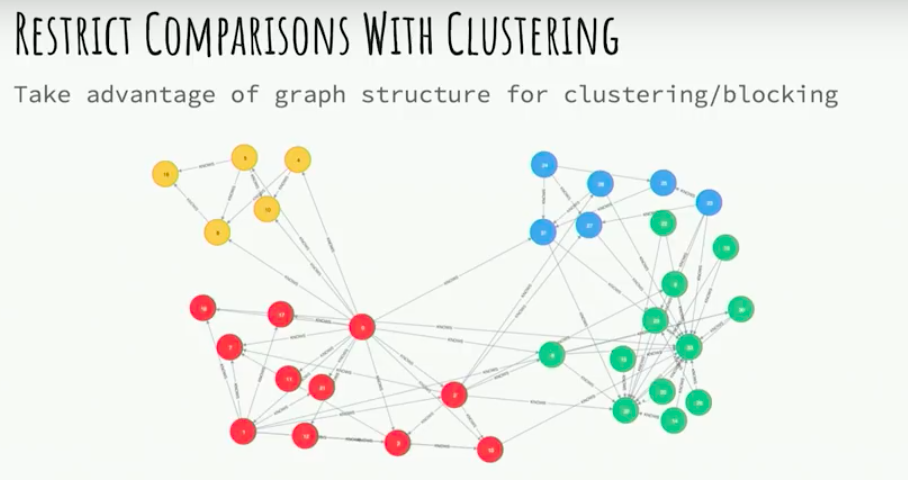
Another approach to using the graph structure is to actually bring model development into the graph.
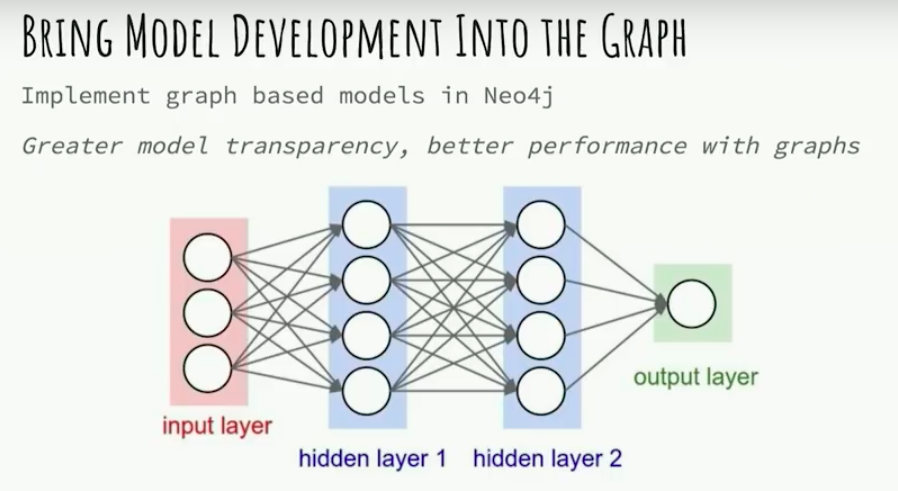
It’s hard to look at all of the machine learning algorithms and see that they’re represented in graphs as graphs logically and to not want to bring those in as graphs into Neo4j.
You could represent each neuron in a neural network as a node in Neo4j. This could also help us better understand the neural networks that make such great predictions.
Model transparency is a big problem in deep learning today, just because these models assign weights to every edge between the neurons, but humans can’t always understand logically why these weights lead to successful predictions.
Another issue with this is that there is a lot of computation required in maintaining and training neural networks. I’m not sure how that computation would work if the network was represented as nodes in the graph. There would definitely need to be some optimizations made.
Model Version Control
Another interesting approach related to this is model version control.
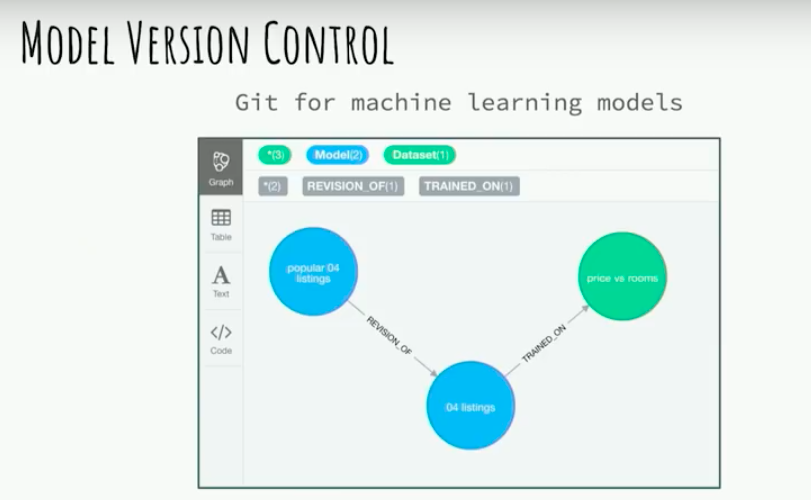
Version control of machine learning models is definitely a graph problem because as you’re developing the models you don’t just immediately know what to do.
You have several different versions of models that develop from each other, and also slightly altered data sets. Representing those relationships in the graph would make for a really interesting graph problem and help increase the transparency in the process for building machine learning models.
New Graph-Based Machine Learning Algorithms
Finally, this is an area that most excites me. When I think about machine learning and graphs I think how could graphs allow us to make insights that we otherwise wouldn’t be able to? Where is the benefit? Neo4j is always growing, expanding and innovating new ways to dive into and better understand graphs.
In research papers there are a lot of new machine learning algorithms that rely on graph-based input instead of vectors. For example, the graph edit distance would be a similarity algorithm that takes graphs and quantifies the similarity between sub-graphs. If your input data is in the form of a graph, then you don’t need to flatten your graph data into a vector.
Graphs have a better way to express our data. Graphs are everywhere, for everyone.
New to graph technology?
Grab yourself a free copy of the Graph Databases for Beginners ebook and get an easy-to-understand guide to the basics of graph database technology – no previous background required.


