Interactive notebooks are rising in popularity and replacing PowerPoint presentations in many organizations.
In this post, Larus Data Engineer Andrea Santurbano discusses how he uses Zeppelin and Neo4j in different contexts. Andrea helped build a Zeppelin Interpreter that connects directly to Neo4j in order to query and display data directly from the Notebook.
He starts by defining a notebook and indicating why they are increasingly more useful. Then, he delves into the three pillars of Apache Zeppelin. Last, Santurbano explores the three main features of Cypher on Apache Spark (CAPS).
Full Presentation: Empower Data Projects with Apache Zeppelin & Neo4j
Today, we’ll talk about how to empower data projects with Apache Zeppelin and Neo4j.
About Us
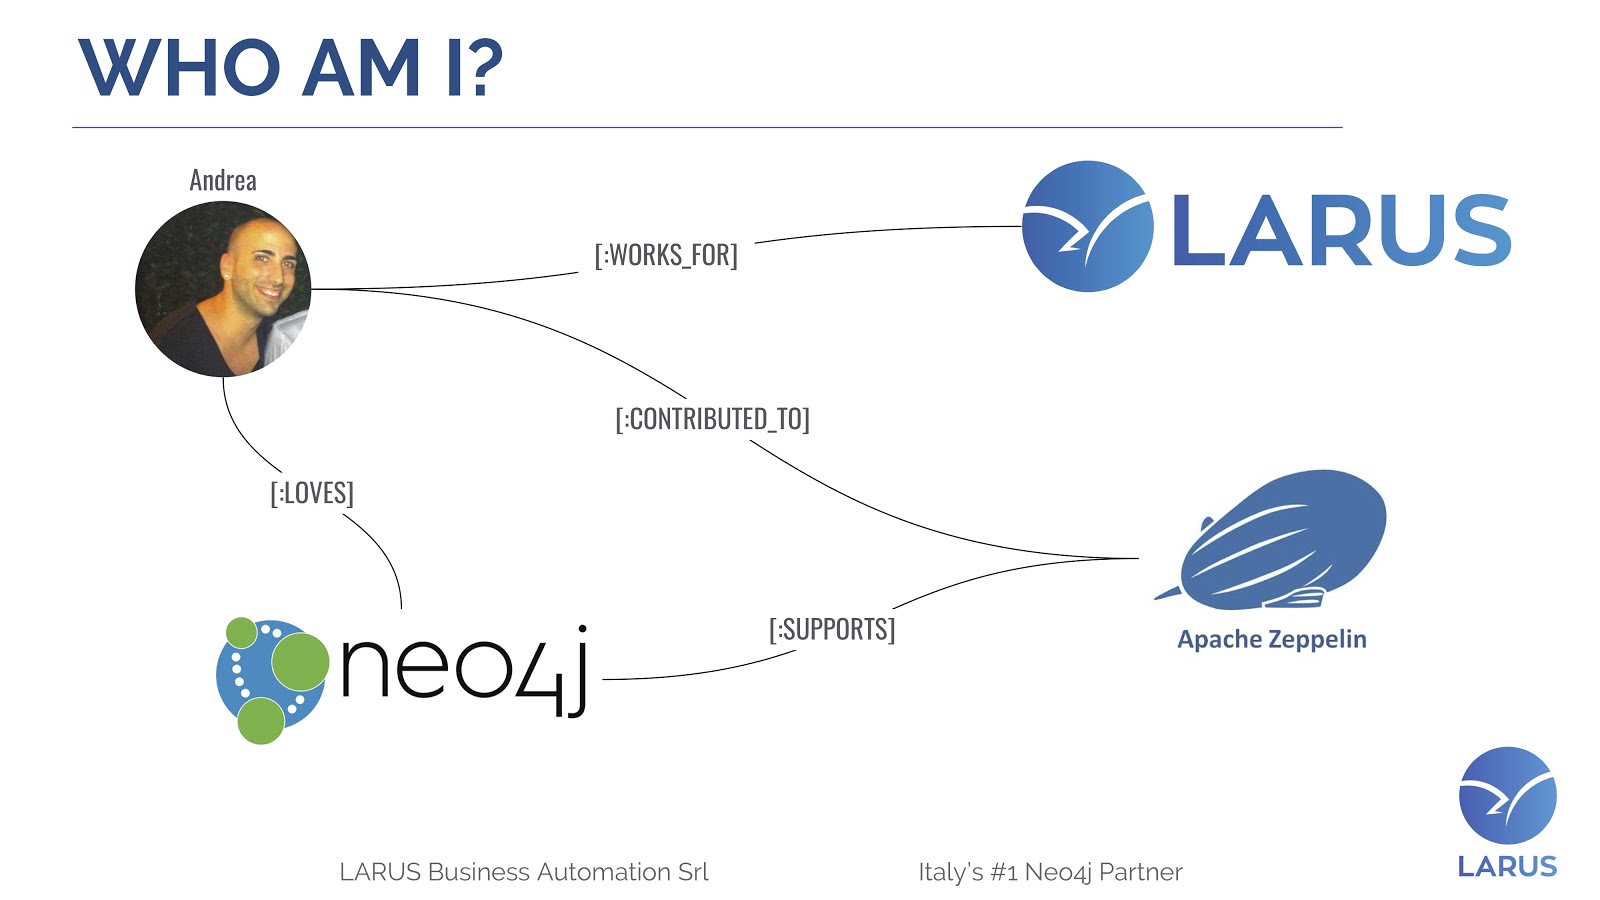
First, let me introduce myself. I’m Andrea Santurbano, and I’m from a small city in Italy called Pescara, which is located in front of the Adriatic Sea.
I, of course, love Neo4j, and contributed to the Contrib ecosystem, in particular to the APOC Stored Procedures. I also contributed to Apache Zeppelin, where I created the connector for Neo4j. Thanks to my contribution, Zeppelin now officially supports Neo4j, and we’ll see how the two work together in this post.
I currently work for Larus, which was founded in 2004 by Lorenzo Speranzoni. Our headquarters are in Venice, Italy. We deliver services worldwide, with the mission of bridging the gap between business and IT.
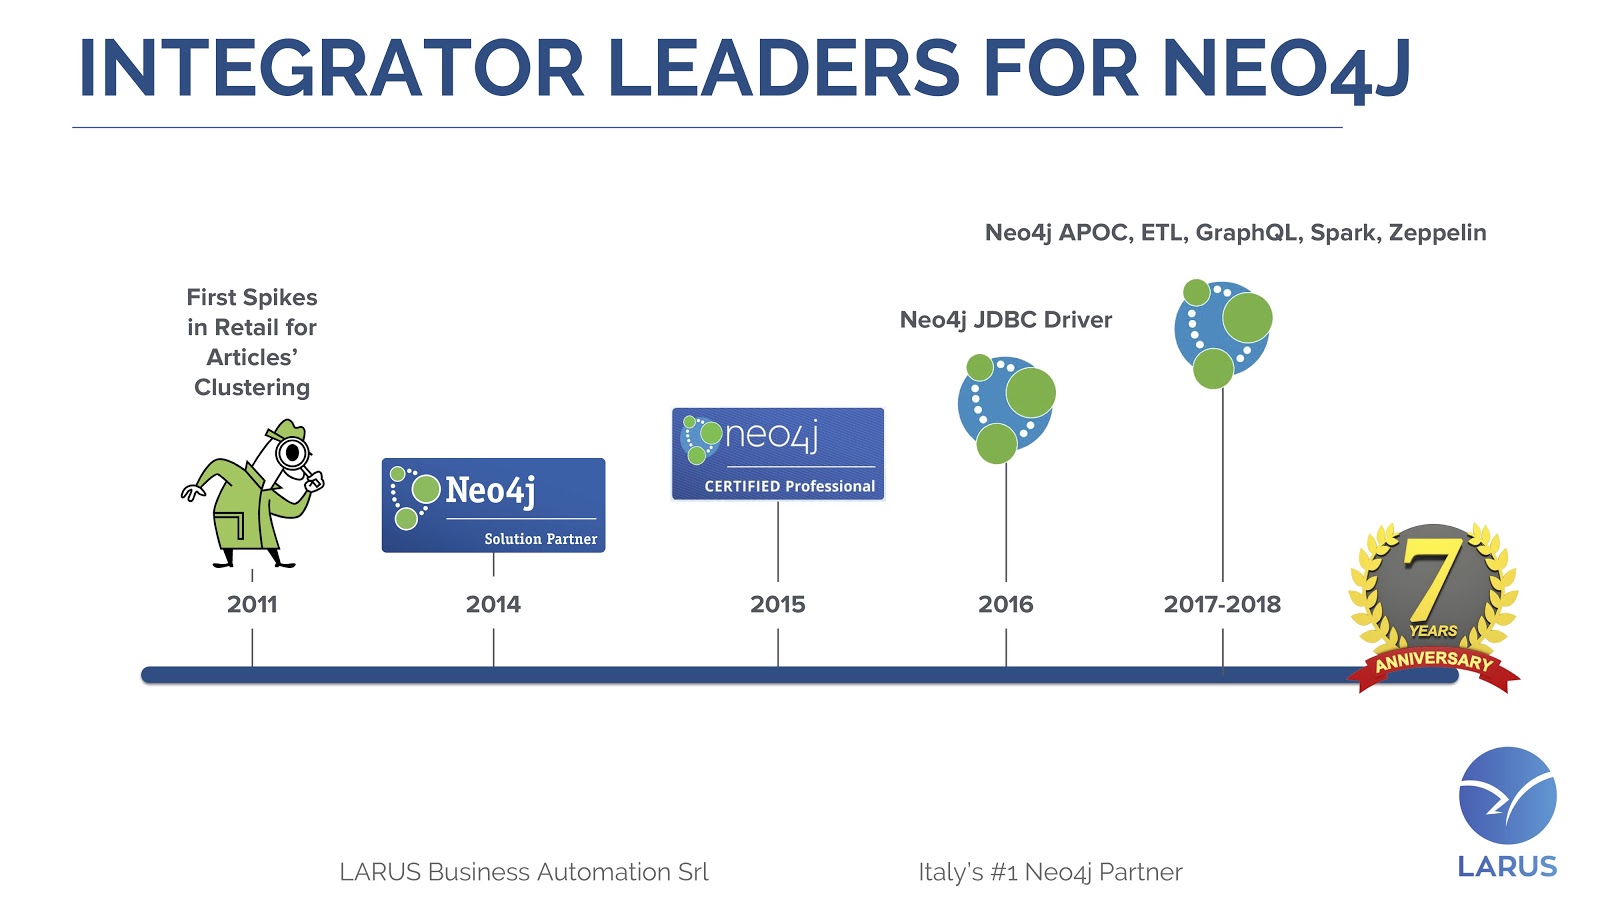
We’ve been Italy’s #1 Neo4j solution partner since 2013. We are also the creator of the Neo4j JDBC driver, the Apache Zeppelin interpreter and the ETL tool. Additionally, we’ve developed over 90 APOC procedures.
The history of Larus with Neo4j is a love story that started in 2011 and brings us to today, in which we have a stronger position in the Neo4j Contrib ecosystem.
In this post, we’ll discuss what Apache Zeppelin is, as well as its history. Moreover, we’ll talk about how Cypher for Apache Spark (CAPS) can be integrated with Zeppelin.
What is a Notebook?
In order to understand what Apache Zeppelin is, we first have to understand what a data science notebook is.
Data science notebooks, in our experience, are rising in popularity. Statistics indicate that the number of Jupyter notebooks – a Zeppelin-like notebook runner – hosted on GitHub has climbed from 200,000 in 2015 to more than two million today.
Why this rising popularity? There’s a growing consensus that notebooks are the best interface to communicate the data science process and share its conclusions. In fact, in many organizations, notebooks are replacing PowerPoint presentations.
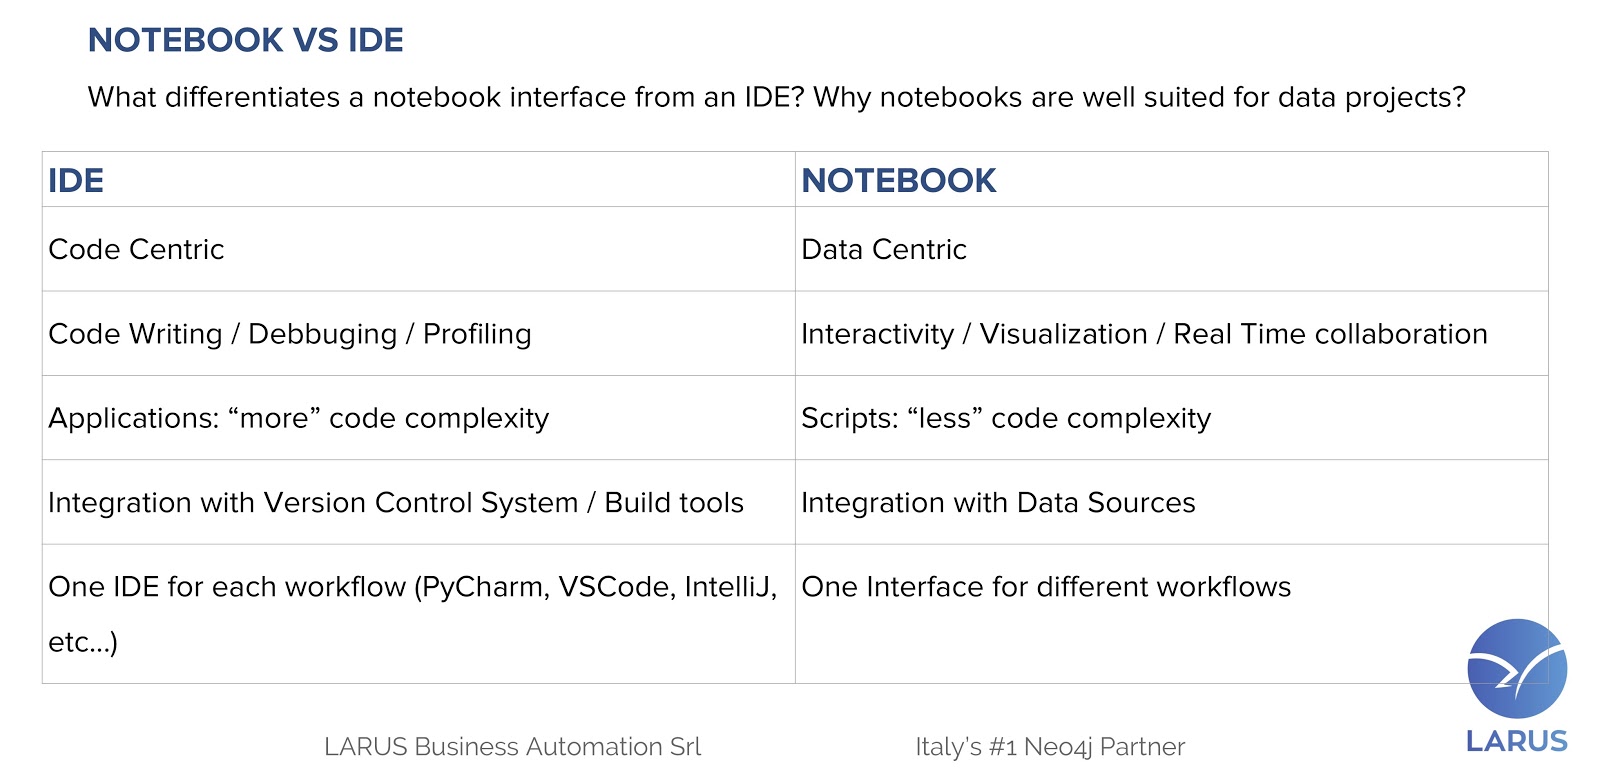
But what is the difference between a notebook interface and an IDE? Why are notebooks well-suited for data projects?
If you think of an IDE, it’s built to be code-centric, and it’s focused on code writing, debugging and profiling. It’s supposed to manage complex applications such as frameworks or web applications. Moreover, it’s usually integrated with a version control system such as Git and SVN, or with build tools such as Maven and Gradle.
Additionally, there is one IDE for each workflow. For instance, if you are a front-end developer, you can prefer Visual Studio Code. If you are a Python developer, you can use PyCharm. If you are a back-end developer, you can use a Java developer, Eclipse, IntelliJ and so on.
On the flip side, we have notebooks, which are data-centric. They are focused on interactivity, visualization and real-time collaboration between users. They’re also built to manage scripts – so there’s less code complexity to manage – and are integrated with data sources.
Moreover, there’s one interface for different workflows. What does this mean? Let’s consider these three common roles in any data-driven organization.
We have the data engineer who can build an aggregation of trillions of streaming events by using Scala as their programming language and IntelliJ as their IDE. This aggregation might require an analytic engineer to build a report about the global streaming quality by using SQL and Tableau. This report might lead a data scientist to build a new streaming compression model by using R and RStudio.
Though these might seem like completely different tasks with no overlap, there are in fact three commonalities: they all have to run code, explore the data and present results.
So why are notebooks important in any data-driven organization? It’s because they address the previously listed tasks and have the ability to independently execute and display the output of modular blocks of code, or paragraphs.
Moreover, notebooks have the ability to interweave this code with a natural language markup such as HTML or Markdown.
The most important thing is that notebooks enable real-time collaboration between users, which is helpful because data projects have always been an iterative process.
What Is a Notebook?
Apache Zeppelin is a web notebook with a pluggable architecture and is the first notebook runner that officially supports Apache Spark. It’s composed of three pillars: the display system, the interpreter and the helium modules.
The Display System
The display system basically renders the output on the front-end.
There is the table display system which basically displays a table. It also came out with another five charts, including the bar chart, the pie chart and so on.
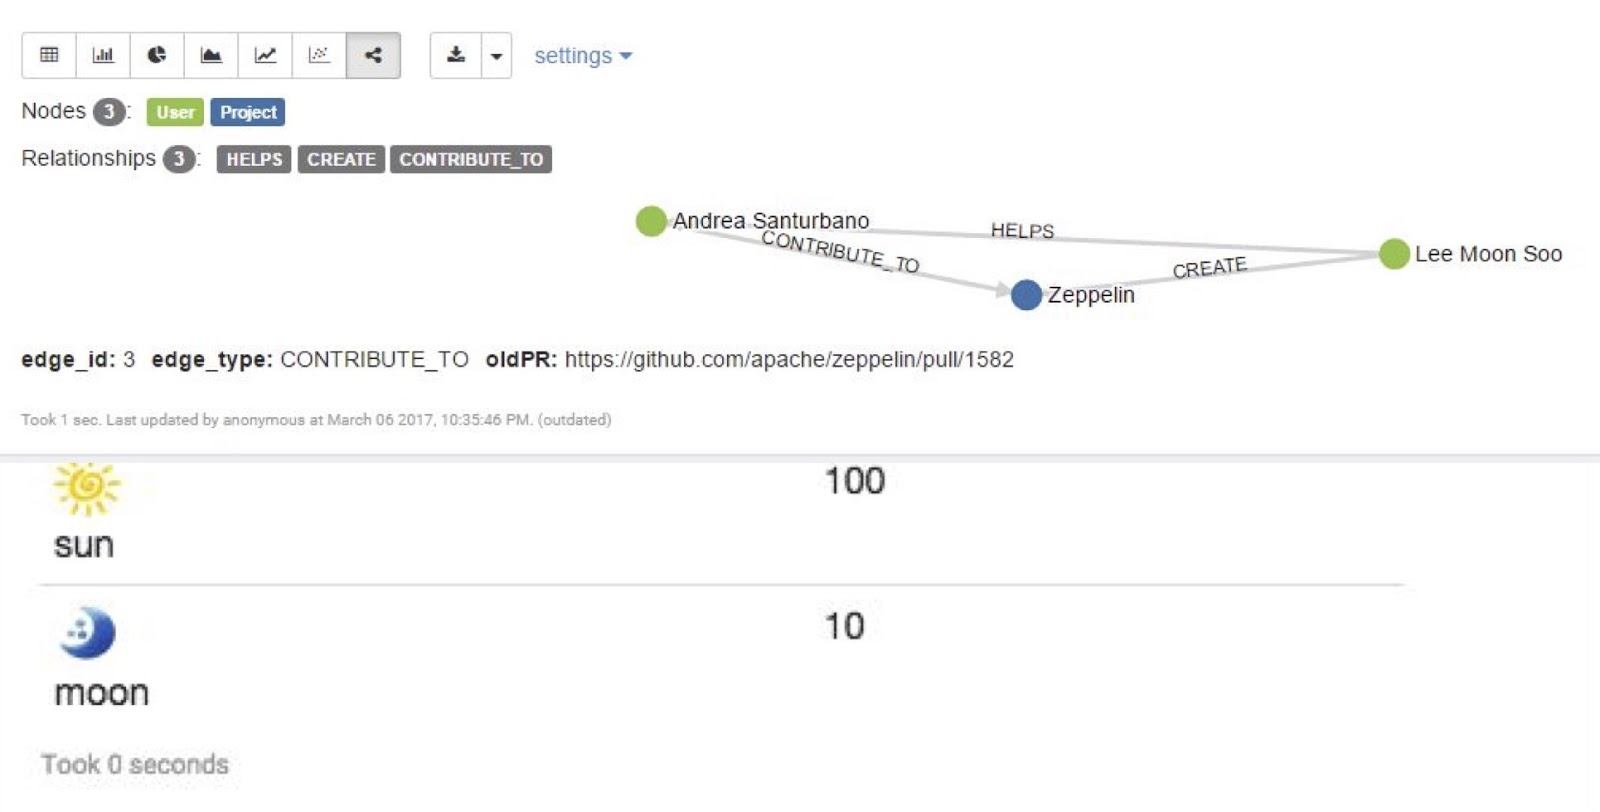
Then, we have the text/HTML display system, which allows us to inject HTML into the tables. Additionally, starting from version 0.8, we’ve had the network display system that allows Zeppelin to display networks.
Interpreter
The second pillar is the interpreter. The interpreter is a plug-in, which enables Zeppelin to use a specific programming language – such as Scala or Python – or a data processing back-end, such as Spark, Pig or Frink.
We have the Spark interpreter, which was the first one that was supported by Zeppelin. We have also had the Neo4j interpreter since version 0.8.
Moreover, we have another 24 third-party interpreters. Each interpreter must be activated using the percentage prefix. For instance, the Neo4j interpreter can be activated by the
%neo4j keyword. Helium
The third pillar is Zeppelin Helium, which is a plug-in system that allows you to easily extend Zeppelin. It’s also composed of three parts.
The first is Helium Visualization, which basically adds a new chart type. Second, Helium Spell adds a new interpreter, which runs only on the front end. These two are basically JavaScript applications.
The third, Helium Application, is a little more complex because it is a package that runs an interpreter on the backend and has a display system that displays the trend of the result on the front end.
Each Helium module can be published on the Helium Online Registry, which is a marketplace of Zeppelin Helium modules, so everyone can download it directly from Zeppelin.
History of [Zeppelin-1604]
The first release was on November 2, 2016. It was a big contribution because one part was the network display system and the second part was the Neo4j interpreter.
In order to simplify the review process of the Zeppelin team, we decided to split it into two parts. The first part was the network display system – Zeppelin 2222. The second part was the Neo4j interpreter – Zeppelin 2761.
CAPS: Cypher for Apache Spark & Zeppelin
CAPS, which can be integrated with Apache Zeppelin, is a very nice project that extends Spark, allowing users to create and query graph data model / property graph model all over Spark. It has three main features.
First, it’s built on top of the Spark DataFrame API, so it can leverage cool features of Spark, such as the catalyst optimizer. Every CAPS data structure representation can always access the respective data frame representation. This way, you can go back and forward switching to a CAPS data structure and to a data frame structure, and vice versa.
Second, CAPS supports a subset of Cypher. In particular, it supports a feature called multigraph, which allows you to build a lot of graphs starting from the same data source multigraphs.
Third, it supports a wide region of data sources. It’s built with an API that allows the developer to easily ingest graphs, and is also easily extendable.
Show off your graph database skills to the community and employers with the official Neo4j Certification. Click below to get started and you could be done in less than an hour.
Get Certified


