Finding Valuable Outliers and Opportunities Using Graph and Spatial [Community Post]

President at DataFoxtrot
2 min read

[As community content, this post reflects the views and opinions of the particular author and does not necessarily reflect the official stance of Neo4j. This article was originally posted by Karl Urich and was used with permission.]
Businesses are capitalizing on the value of analyzing relationships that exist in their business data.
The technology industry and open source groups are building Spatial tools (“where” analysis) and Graph tools (relationship analysis) so that businesses can improve their insight on patterns, trends, and (perhaps most importantly) outliers in the networks.
This article introduces Spatial as a dimension to analyze your relationships in order to find outliers.
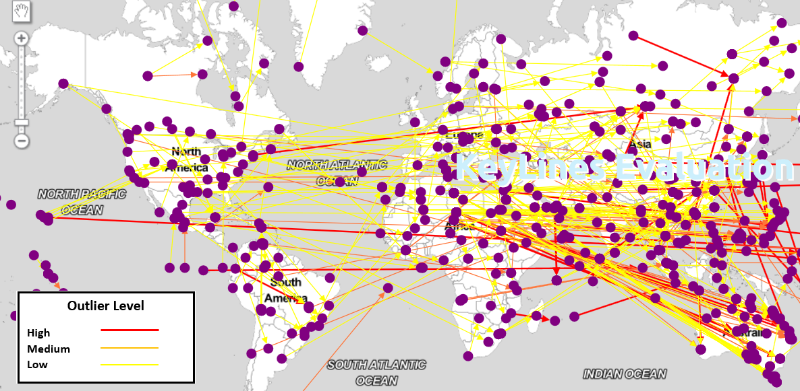
What is a spatial outlier for a relationship between two things? An outlier is something that doesn’t follow the general pattern, and a spatial outlier visualized on a map wouldn’t look near or proximate to any other relationship.
An outlier can represent a business, economic or communication relationship that is beginning to develop, where early awareness can focus attention or investment on the relationship. An outlier can represent the beginning of a negative interaction or scenario that could grow and fester if not addressed.
Visualize Information and Expose Outliers
In my June article, I spoke about the use of graph visualization tools such as KeyLines from Cambridge Intelligence.
We can look at a straightforward example of identifying outliers on a map; using KeyLines we can map a relationship graph depicting the major airports in the United States and their connectivity. The graph shows us that the Anchorage, Alaska airport is a spatial outlier in the network. From there, we can use our intuition to suggest many outcomes …
Read the rest of Karl Urich’s article on LinkedIn.


