Prototyping a Graph Database
Written by Rik Van Bruggen, Originally posted on his blogPrototyping a Graph Database
Last night we did a great meetup in Amsterdam using a new, untested format. We had about 25-30 people attending, to try and prototype a graph database quickly and efficiently.You can find the slides (borrowed from earlier work done by the awesome Neo4j team, Ian Robinson most particularly) over here or embedded above, but here’s the way we approached this, which I think could be a general way of doing things:
First: a Model

- many of the modelling principles are similar to classical use story modelling as I first encountered it two decades ago in OO modelling. Create a story, extract the nouns and verbs to create a basic skeleton of the model.
- think about your use cases and your query patterns long and hard. They will drive the model – you want to model for queryability.
- Don’t be afraid of normalisation. In relational modelling normalisation is expensive – in graph modelling it is not as much. You will tend to have “thinner” nodes and relationships in your graph model (holding fewer properties).
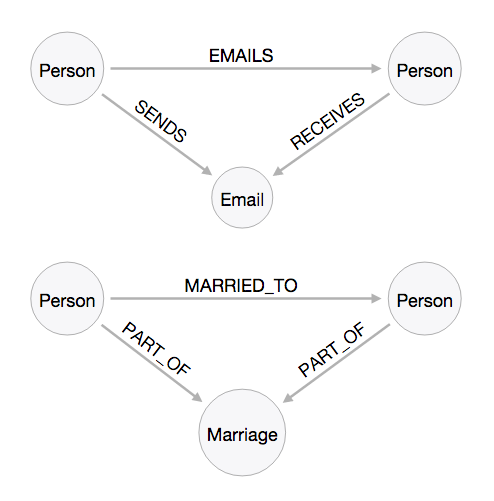
- Don’t be afraid of redundancy: it is very common to have redundancy in the model – within the same database. Look at the different ways to model email exhanges or marriage relationships – you immediately see there are more than one way of doing things, and none of them is necessarily better than the other. It *depends* on your requirements, your queries.
- Iterate over the model – and understand that as your business requirements change, you may want/need to change the model.
Second: a prototype dataset
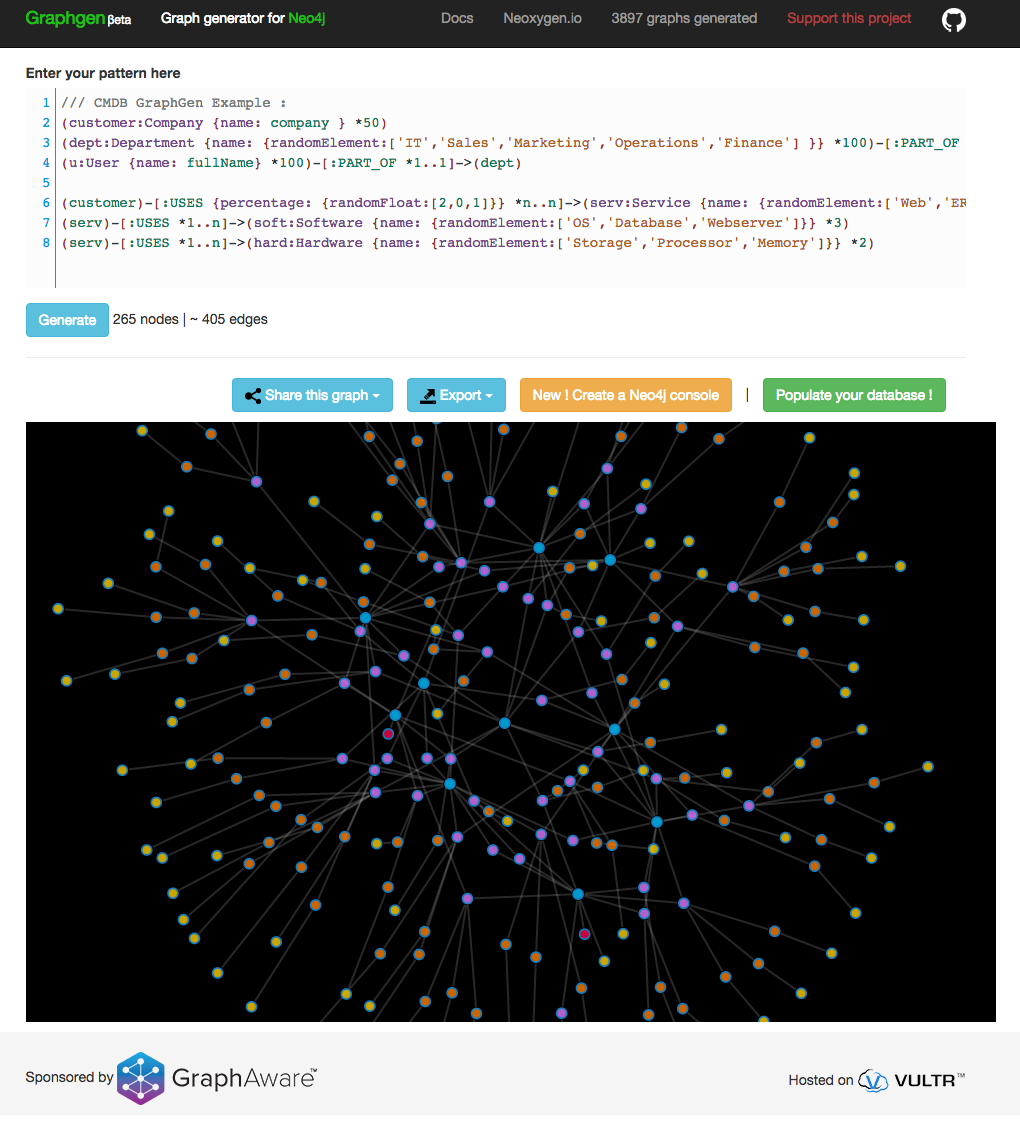
We then had a great time applying that model to generate an actual Neo4j database using Christoph Willemsen’s GraphGen. It’s amazing how quickly you can get a running Neo4j server populated with some sample data that is worth the while exploring. Here’s my GraphGen model: /// CMDB GraphGen Example :
(customer:Company {name: company } *50)
(dept:Department {name: {randomElement:['IT','Sales','Marketing','Operations','Finance'] }} *100)-[:PART_OF *n..1]->(customer)
(u:User {name: fullName} *100)-[:PART_OF *1..1]->(dept)
(customer)-[:USES {percentage: {randomFloat:[2,0,1]}} *n..n]->(serv:Service {name: {randomElement:['Web','ERP','CRM','Mail','Calendar','Files']}} *10)
(serv)-[:USES *1..n]->(soft:Software {name: {randomElement:['OS','Database','Webserver']}} *3)
(serv)-[:USES *1..n]->(hard:Hardware {name: {randomElement:['Storage','Processor','Memory']}} *2)Here


Third: some traversals!
Last but not least, we then spent some time looking at the generated datasets and exploring some queries. To do that, I first had to add a few indexes for the queries to be efficient. Effectively adding the indexes on the labels’ properties that I wanted to look up starting points with for my traversals.- Starting from the Hardware/Software end: asking the question about who would be impacted if a particular piece of hardware/software would fail. An example query would look something like this:
 match (h:Hardware {name:"Storage"}),(u:User), p=AllShortestPaths((h)-[*..5]-(u))
 where id(h)=865
 return p;
- Starting from the User end: asking the question about what hardware/software pieces a particular user accesses. The query looks like this:
 match p=Allshortestpaths((u:User {name:"Leland Blanda"})-[*..5]-(h:Hardware))
 return p


