Responsible AI: The Critical Need for Context (and Practical Tips)

Graph Analytics & AI Program Director
9 min read

Why is it that we naturally talk about graphs as if they were context?
That’s because graphs were built to understand relationships – in fact, it’s how graph theory started. Graphs were not only built to understand relationships, they were built with relationships. And that’s significant, because in nature you don’t get any unrelated, isolated data points.
Graphs help us incorporate the fabric of connections in the data we have to actually hook it together, which enriches that data and adds more value.
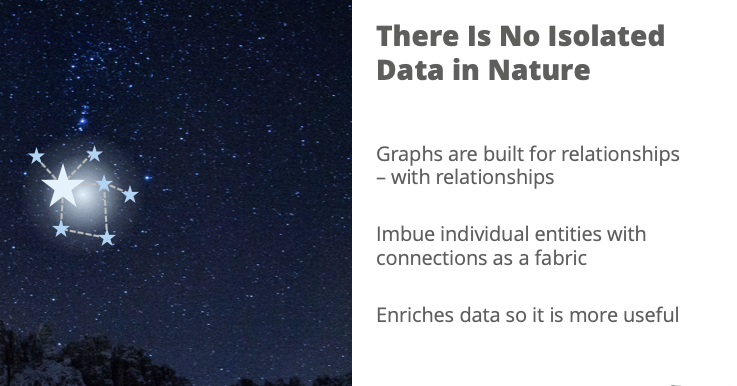
If we think about the stars, there are lots of individual, pretty points of light that are very nice to look at. An individual star doesn’t mean a whole lot – we can’t do much with a star other than admire it. But when we started to look at an individual star in context of other stars in the night sky, we now have a constellation. With the context that constellations provide, we have been navigating for thousands of years.
Then, if we think about layering on additional context and information, we start to develop maps, which helps us answer all sorts of questions: How do I get from point A to B? How many routes are there from point A to B? What’s the most efficient manner for me to do that? And then, we can add in more context like traffic, to answer practical questions, such as how do I reroute during different times of day when traffic is bad?
Imagine adding in even more context. such as what companies like Lyft are doing to innovate transportation. We’re now able to add more information, such as multiple user requests. We can layer on more context, like their various pick up and drop off needs. And ultimately, we add more value in the form of well-coordinated rides. It’s efficient for the driver, for the riders, and a pleasant experience – everything happens seamlessly.
The more you add context, the more value you add to the data and what you’re already doing.
How Responsible AI and Context of Graphs Go Together
Why would we put the context of graphs with responsible AI together? How do these things fit? There are four different areas I believe are really important, and they fall into two larger buckets.
One bucket is around robustness and having solutions that are more predictably accurate and having solutions that are more flexible. The other area is trustworthiness and how we enhance and increase the fairness and explainability with our models.
To illustrate these important areas of responsible AI, let’s look at some examples.
Example 1: Opioid Insurance Fraud
The first example is a rather serious one. With the Opioid Crisis, it was estimated several years ago that there was $72 billion a year in opioid insurance fraud. And recent estimates of the direct cost of opioid abuse on U.S. services (items such as healthcare, legal, childcare and support care) to be approximately $100 billion a year.
This is a significant issue, and experts believe fraud is an area to target because we have the data – we know where the money flows. There’s been some really interesting work done on opioid fraud prediction (research paper linked below).
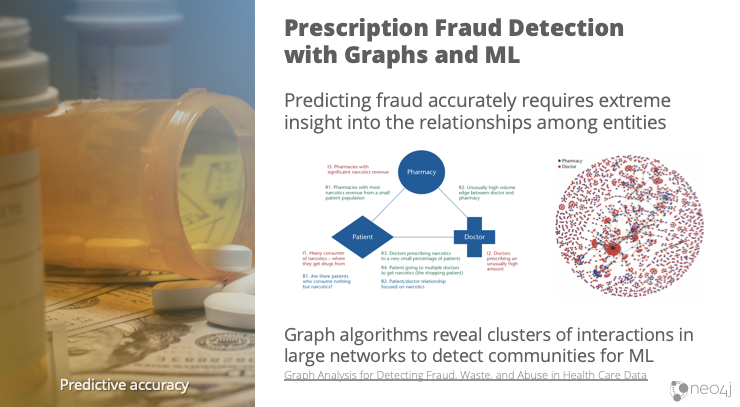
Looking at this insurance information, using community detection graph algorithms, we see the relationships between doctors, pharmacies and patients, and how tight those communities are.
Fraud has shape to it, and graphs are really good at understanding the topology of your data. You can use things like relationships and community detection to extract out different communities, and then use your machine learning to more accurately identify fraud.
An example of this method can be found in the research paper, Graph Analysis for Detecting Fraud, Waste and Abuse in Health Care Data, where they used graphs to find structural communities that were more predictive of fraud.
In the research, and our experience, graph feature engineering tends to improve model accuracy with the data and processes you already have. It’s simply a matter of adding relationship features to what you’re already doing.
Example 2: Driverless Cars
Beyond accuracy, another example is having confidence in things that are fairly serious. Driverless cars is one of those areas that I sometimes get very nervous about. One of the recent stories was the Tesla car that changed lanes based on stickers in the lane. That makes me very apprehensive about buckling myself up in a driverless car.
The problem is not just cars, but anything important that makes autonomous decisions or semi-autonomous decisions. In these circumstances, situational awareness is critically important – especially if they’re broadly implemented.
If we consider semi-autonomous cars, they’ve been trained for specific circumstances. They don’t necessarily react as humans would to a flock of birds or a plastic bag fluttering in the road. They may stop abruptly in these situations, where we would keep going, and cause an accident.
So dealing with situations more comprehensively, and being flexible to different situations, is essential for us to safely implement AI in larger environments. That means being able to learn based on context and incorporate adjacent information – which is what graphs are all about.
Example 3: Data Manipulation
Another area of concern when it comes to IA is humans trying to subvert systems.
I want to rely on my AI systems and what comes out of them. And I could have the best system in the world. But if my data has been manipulated, how do I rely on that? What if I’m managing an energy grid? Or maybe more relevant for many of us at the moment, what if we’re talking about voting systems?
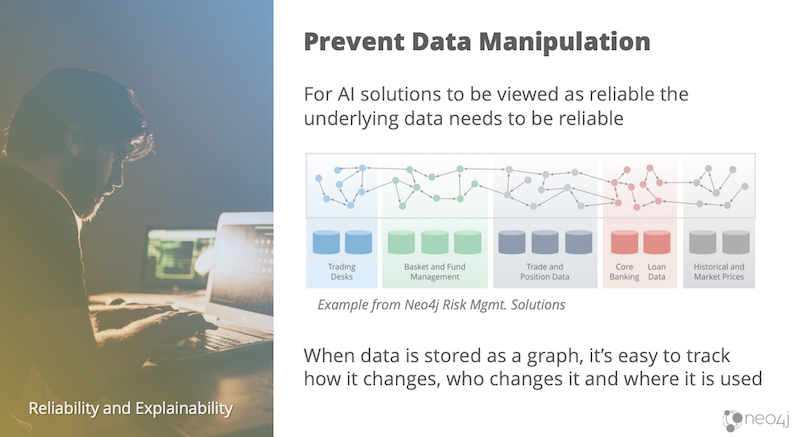
I need to know where the data’s been and who’s touched it. I need to know exactly when it was changed. I need to know what the chain of relationships are and how that data may be used somewhere else. That’s a classic graph data lineage problem.
Trusting your systems so you trust the data is essential. You could have fantastic, unbiased data – but if someone tweaked that data, the outcome is no longer trustworthy. Fortunately, graphs are really good at allowing us to track the chain of data change and subsequent ripple effects.
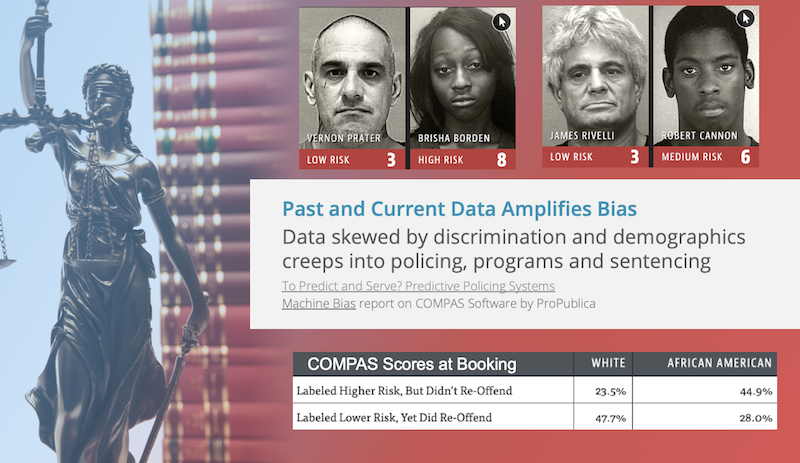
Thinking back to the COMPAS software for risk assessment, this system is also used in many cities when a person is booked, before they’re indicted or have criminal charges. The software is used to assess the risk to reoffend, and the public defender, lawyer and others may view this score and use it to make judgements. The COMPAS software consistently gives black Americans higher risk scores than white Americans, and this risk assessment is still in use today.
How could we try to make this system more fair and ethical? There are probably many opportunities to do better, but because I’m most familiar with graphs, I can share how graphs help reveal bias in the data itself.
Part of seeing bias in data that is often overlooked is knowing where your data came from, who collected it, how they collected it and when they collected it. There’s a chain of events in data collecting and how it’s used. If we better understand the chain of events – which is very much a graph problem – we help reveal biased data that otherwise may not be readily apparent.
Graphs add the context of data origin, but as I explained in the opioid example, you could also use graphs to add different predictive features based on relationships. Graphs help us understand where our data came from, track the lineage of changes and add predictive elements based on behavior instead of demographics.
The Future of AI and Graphs
So what’s next for graphs and AI in the future?
We’re already seeing human values be considered when driving change in AI regulation. As this starts to accelerate, the adoption of AI itself will accelerate, because AI is not going to be widely adopted until we trust it aligns with our values. If we want to accelerate AI adoption, then we must consider the societal values where it’s being implemented.
We’re already seeing traction in graph technology and data science, machine learning and AI, in a number of different use cases. Drug discovery, financial crimes, fraud, anti-money laundering, recommendations, churn prediction, subscription services, cyber security and predictive maintenance – lots of different use cases – but I think what’s going to change with AI in the future is that it’s just going to be standard.
If you have an AI system, there’s going to be some kind of graph component somewhere. And part of that is bringing in context and the power to remove some of AI’s limitations.
Practical Tips for Responsible AI
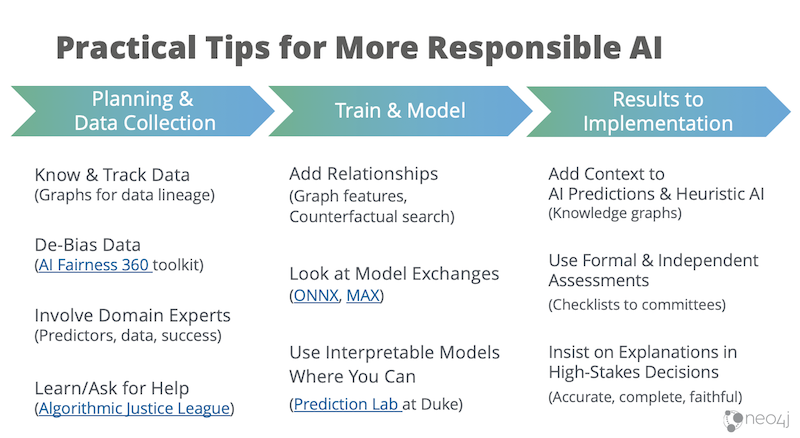
We’ve gone over some big, conceptual ideas in this blog. For those of you who code, or manage people who code, I realize these abstract goals are daunting. The good news is there are some practical things we can all do today to be more responsible about AI.
If you’re in the initial stages of planning and collecting data for an AI system, the first thing is to know what’s in your data and track your data – that’s table stakes, very simple. Hopefully you use Neo4j to do that, because graphs are great for tracking data.
Other practical tips for more responsible AI:
- Debias Your Data
There are toolkits out there to help balance and remove bias from your data such as the AI Fairness 360 toolkit. - Involve Your Experts
Your data doesn’t necessarily speak for what is most predictive or what success looks like, so include subject matters experts all along the process. - Use Developer Resources
Access more tools, like the Algorithmic Justice League, for understanding things like more fair algorithms and advice. - Use Interpretable Models
If you have a Black Box model and an interpretable model that are equally accurate, you should favor the method that can be explained. The Prediction Lab at Duke University provides practical papers for guidance and free code for interpretable models. - Add Context, Like a Knowledge Graph
You can add knowledge graph to an AI system so it can make better predictions using context or for faster heuristic decisions. For example, adding a knowledge graph to a shopping chatbot so users are directed to the best product to fit their current needs. - Conduct a Risk Assessment<
You need to look at the potential outcomes of your model performing poorly – before you put it into production. It could be something as simple as a checklist or a committee to review risks.
A final thought on practical tips: If you have high-stakes decisions (things that could negatively impact lives) insist on lay-understandable explanations that are accurate, complete and faithful to what the AI system is actually doing.
Conclusion
I have some final thoughts on the future of AI. The first thought is that AI is not all about machine learning. Context, structure and reasoning are really important for us to improve AI. Graphs and connected data are key elements that allows us to do that, and that’s why we’re seeing the research involving graph significantly increase.
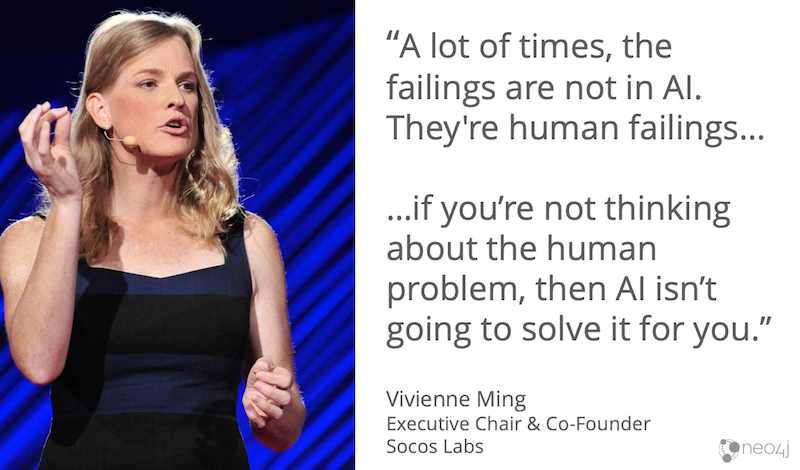
The second thought on the future of AI is encapsulated in this quote from Vivienne Ming:
“If you’re not thinking about the human problem, then AI isn’t going to solve it for you.”
The danger now is that the power and reach of AI is so significant. More significant than it has ever been. But we cannot AI our way out of all of our problems. In particular, if we’re codifying our own human flaws, we’ve got to deal with the human flaws at the same time.
Graphs enable us to address a number of shortcomings in our technically based AI systems, such as the difficulty of adding behavioral data to ML models. Graphs also help address some of our human flaws, too, whether it’s considering the context of our data sources or guarding against data manipulation.
Ready to watch Amy’s entire talk on Responsible AI? View it right here. (Or, go back and read Part 1 here.)
Read the white paper, Artificial Intelligence & Graph Technology: Enhancing AI with Context & Connections
