Since the launch of Neo4j Bloom in 2018, visualizing your Neo4j graph database has never been easier and more powerful. Neo4j Bloom is a beautiful and expressive data visualization platform that allows developers and data scientists to easily visualize and freely interact with Neo4j graphs. Bloom also makes it simple to translate complex data concepts and findings for less tech-savvy stakeholders.
In the latest Neo4j Bloom 1.9 release, we’ve added a few improvements to the overall user experience that will help simplify workflows. Let’s dive right in.
Property Tooltips for Nodes and Relationships
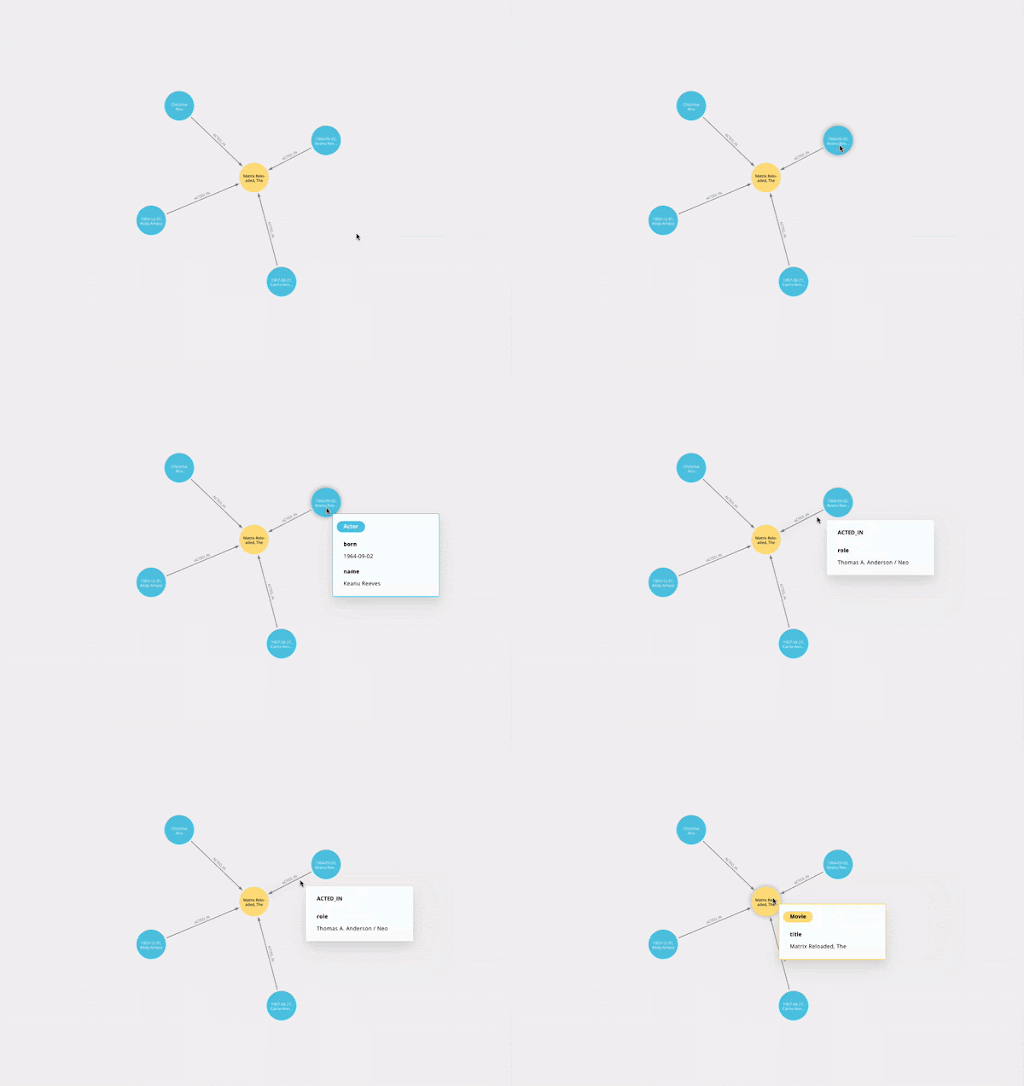
To make your graph data exploration simpler than before, node captions now appear in the tooltip while hovering over a node or relationship. Simply specify multiple captions in the Perspective drawer for your categories to see more than one property in the tooltip.
Tooltips are super useful when your graph is zoomed out and you want a quick view of specific nodes or relationships – for example when inspecting supernodes or bridges between large groups. They’re also useful when you’re zoomed in and can’t see all of the properties you’re interested in. Sometimes nodes are too small to fit their caption text, let alone multiple property values.

Reveal Relationships
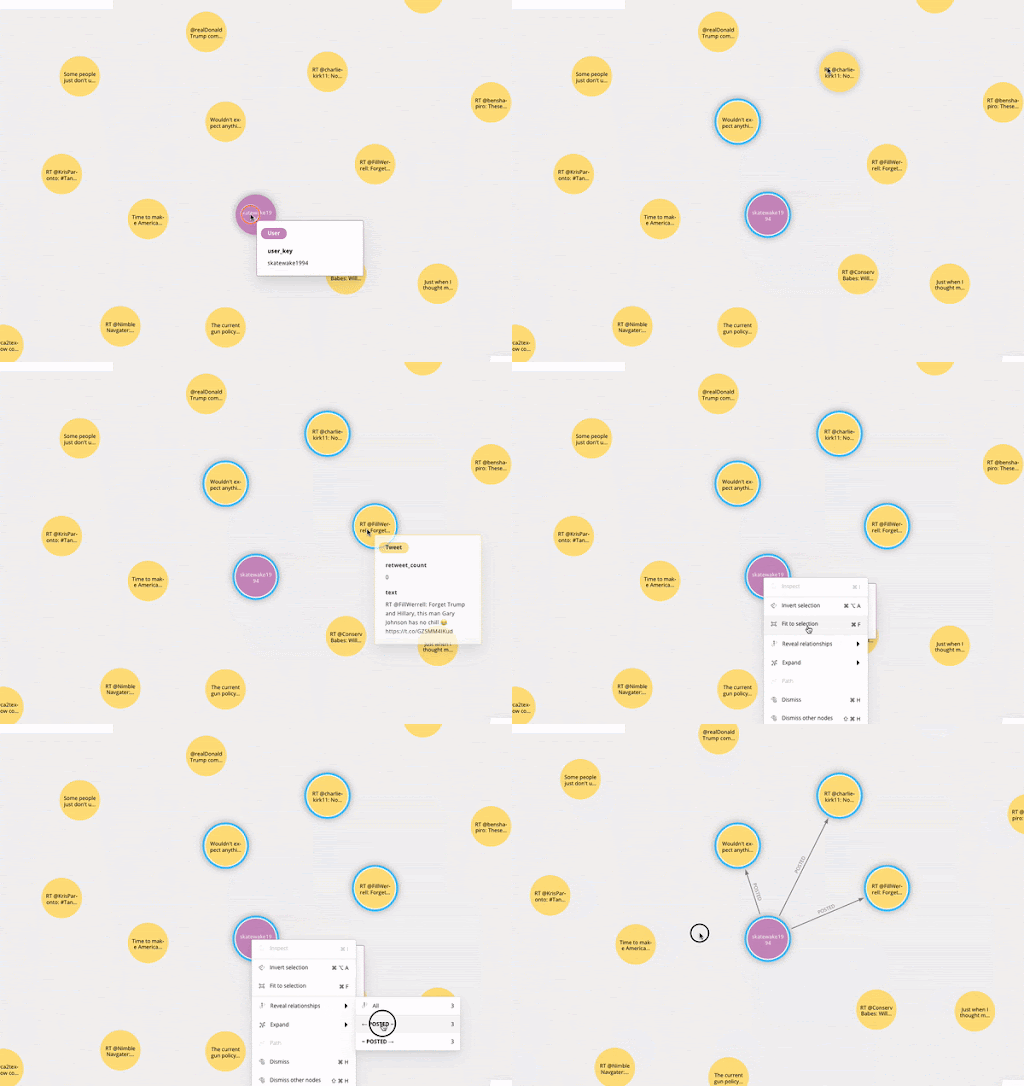
Revealing relationships between nodes just got a whole lot easier without cluttering your canvas. Simply select the nodes of interest to explore relationships between and use the context menu to “Reveal Relationships” between them.

In some scenarios, you may find two or more different categories of related nodes on your scene (for example, “employee” and “team” nodes), but their relationships haven’t been loaded. You can simply highlight a group of nodes (or your whole scene, if you prefer), and reveal all relationships between them (assuming the relationships are visible in your current Bloom perspective), or choose to reveal a specific relationship type.
In other examples, you may have connected nodes across various relationship types, but you want to make sure you’re aware of all the various connections between them. Once again, you can highlight the grouping of interest, and reveal any additional relationships you’re interested in.
Card Improvements
And lastly, you can now expand/collapse cards to see all of the node’s properties without having to double-click into its Detailed View. This should ease graph exploration and allow you to make quick use of more properties in your data.

How to Upgrade
- Users of Neo4j Desktop should automatically receive the update, or install the latest version of Bloom using the Graph Apps drawer.
- Users of the server plugin or a self-hosted web application can download the updates on our downloads page.
- Aura users should see the update appear automatically with a future Aura update.
We Want to Hear from You!
Catch a bug? Or maybe you have feedback/suggestions on how we can improve your user experience? We’re listening! Tell us what’s on your mind at canny.io.
Wish to Become a Bloom Co-Designer?

We’re interested in learning about how you use Bloom and sharing how we design an experience tailored for your needs. If you’re up for a conversation, sign up here.
As a bonus, enjoy a reward of $100, a charity donation, or a special community acknowledgment for your time.


