Standard Chartered: Threat Intelligence Using Knowledge Graphs
7 min read
How DBS Connect Knowledge with a Knowledge Quotient Framework
6 min read
How Banks in ANZ Use Data-Driven Insights to Optimize DevOp and Cloud Migration
7 min read
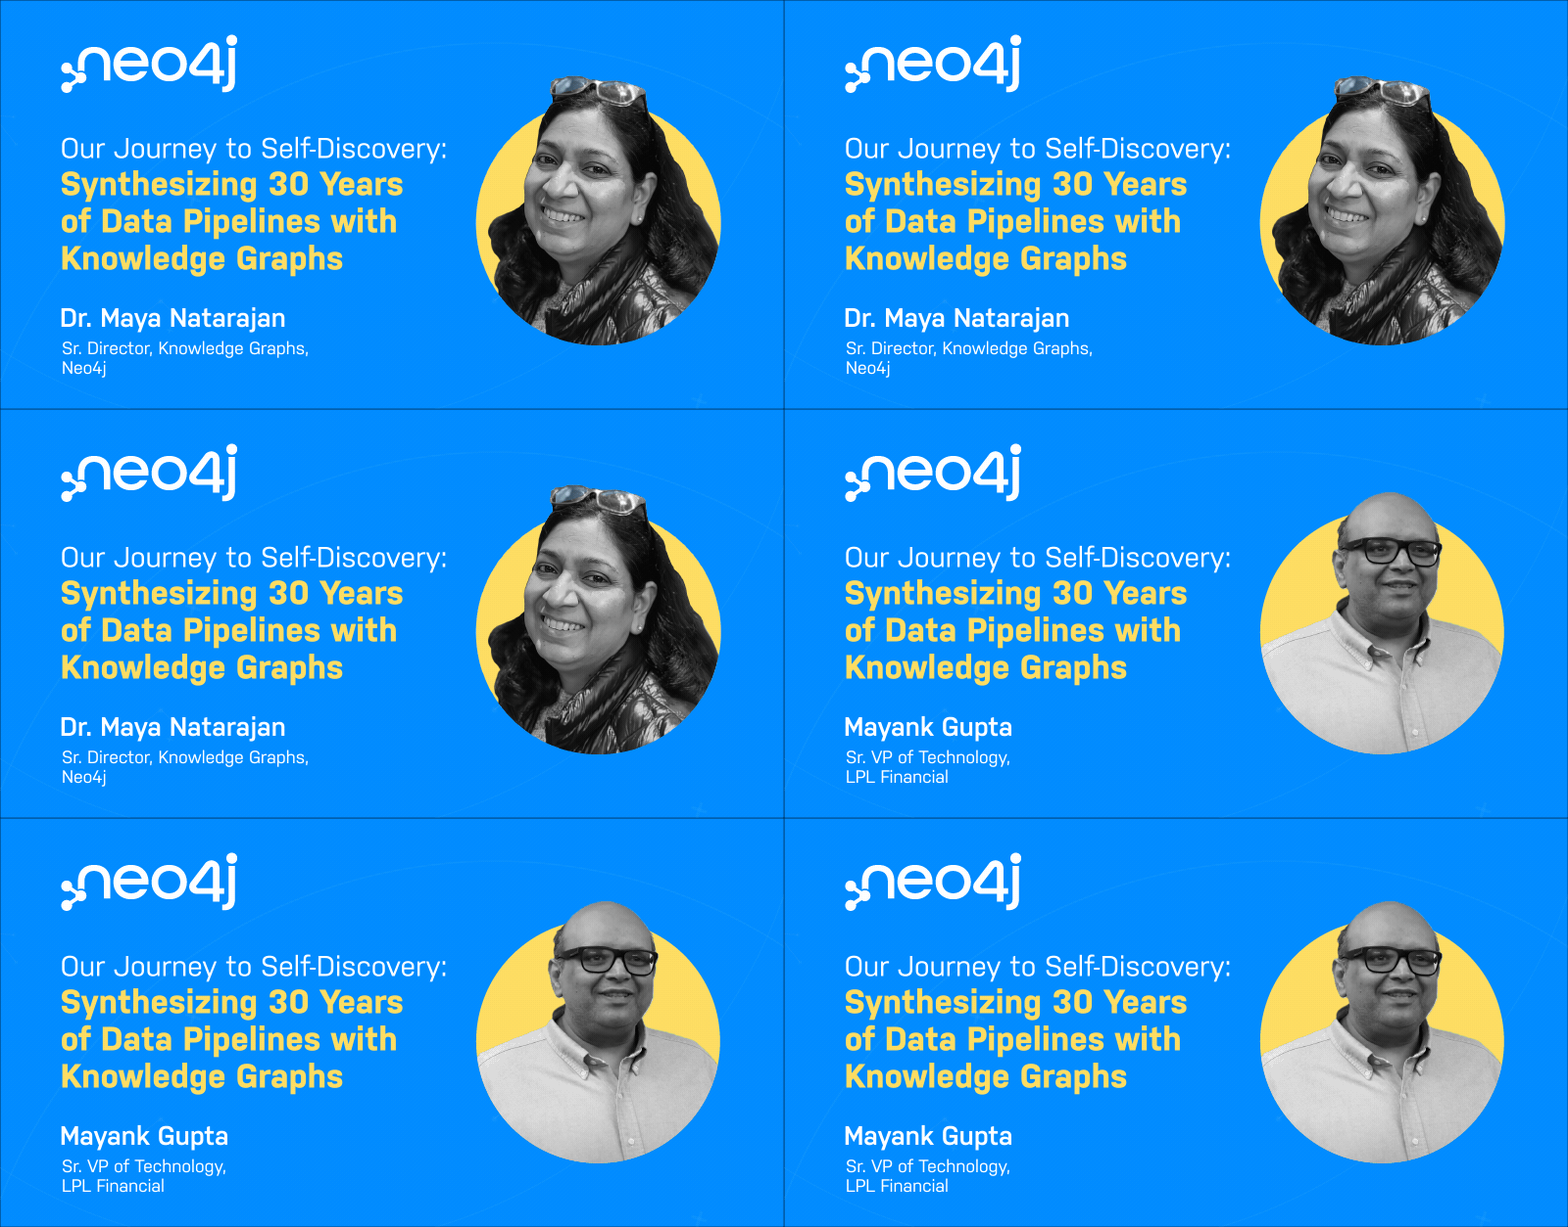
Our Journey to Self-Discovery: Synthesizing 30 Years of Data Pipelines With Knowledge Graphs
10 min read