Demystifying Environmental, Social, and Governance (ESG) Reporting With Graphs
6 min read
Data Lineage: Using Knowledge Graphs for Deeper Insights into Your Data Pipelines
6 min read
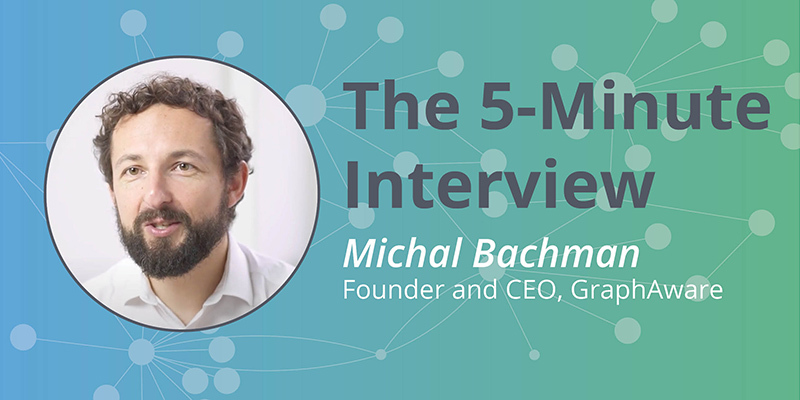
Leading the Global Growth of Graphs: The 5-Minute Interview with GraphAware
4 min read
