This Week in Neo4j – 4.0 Milestone Testing, Highschool Popularity Algorithms, Minecraft Crafting Tree, Cancer Graph and Social Network Pagination

Developer Relations Engineer at Neo4j
5 min read

Happy Saturday everyone,
Mark Needham, our trusted curator of “This Week in Neo4j is off for a few weeks to be with his newborn baby daughter – All the best for your family Mark!
So we will take care that your weekly update of interesting things from the Neo4j community continues, sorry for the slip last week.
This week, a new milestone release of Neo4j 4.0 became available for public testing, and Joe Depeau shows us how to find the popular kids in high school with the PageRank algorithm.
We also have a post on creating a custom procedure for paging through query results, a final wrap-up of a Minecraft data series, and interrogation of a cancer graph with Neo4j Bloom. There’s new releases of Neo4j OGM and yFiles visualization for Java, as well as a tutorial to install Graphlytic as a graph app and Neo4j participating in Kafka Summit, too.
That’s all for this week. Have a great week!
Cheers,
Jennifer Reif
Developer Relations Engineer
Featured Community Member: Paul O’Neill
Our featured community members this week is Paul O’Neill
Paul is a software developer from Edinburgh, who’s currently taking a career break to focus on his family and learning new topics (like graphs)! His career so far has been a mixture of firmware, on-premise, and cloud software development at a mixture of startups, consultancies and financial sector clients.

Paul O’Neill – This Week’s Featured Community Member
Paul has been very active in the Neo4j community in the last few months creating a lot of very interesting content on Neo4j especially around data modeling and a whole series of representing Minecraft Craft Trees as a Graph (see below). Thank you for all of your contributions, Paul!
First Neo4j 4.0 Milestone Release for Public Testing Available

In preparation for the 4.0 major release of Neo4j this fall, engineering has released a public milestone release for everyone to test out some of the new features coming up! The 4.0 version will include exciting capabilities such as reactive support, multiple databases, additional security and role management, new Spring capabilities, and optimizations for the database and algorithms. This is just the beginning, and we can’t give away all our secrets. 🙂 Check out the blog post from Ivan to see more details about what’s in this milestone release and take it for a spin!
Popularity and PageRank at Westerburg High

Many of us can relate to or have seen movies on the popularity battles in a typical high school. But what if we could actually present concrete evidence of popularity scores? Our very own Joe Depeau combined the power of the PageRank algorithm with high school relationships from a film to find the real results and determine the social hierarchy. He shows us how to use the relationships and weighting to calculate the score and then analyzes the results. To top it off, the results are visualized in Neo4j Bloom, showing how you can drill down and explore the network.
A Minecraft Crafting Tree as a Graph

Paul O’Neill has finished his 6-part series on the topic with a retrospective this week. He reviews the takeaways throughout the project and discussed what worked really well between Neo4j and their use case and what didn’t. He touches many of the concepts that are vital to developers in any solution – data import and cleanup, Cypher, and data modeling and refactoring. APOC gets a special mention, noting the power provided in a single procedure. The series concludes with the business questions that Neo4j can help users solve.
Navigating a Social Feed with Pagination

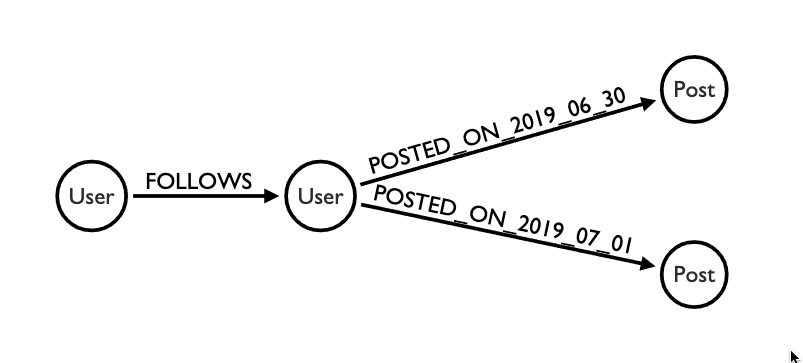
Adam Cowley was inspired to write some code for traversing a social graph with a custom cursor for pagination. Starting with some background on why a social feed fits well in a graph, he compares other solutions to the capabilities graph can provide before launching into the data model. He then walks through creating user-defined procedures with Neo4j and each step of the code to write one for paging results. It even goes into testing and deploying the custom code!
Interrogating a Cancer Graph with Neo4j Bloom

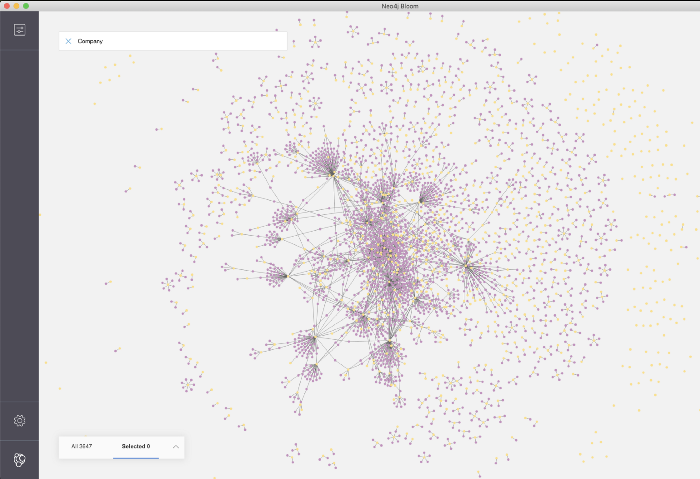
@LiveDataConcept published a blog post on exploring a knowledge graph of cancer data in Neo4j Desktop using our Bloom visualization tool. The authors shows how the tool can help segment the data to highlight the segments of interest and help users explore a complex and highly-related domain. There is also a wish list of features for the Bloom tool! Throughout the post, we can see that connecting cancer data in a knowledge graph has the potential to grow and provide more value as we explore the universe of data around us.
New version of Neo4j OGM, Graphlytic Tutorial, Neo4j at Kafka Summit, New yFiles Version for Java

- Neo4j’s Spring team released an update to Neo4j OGM.
- Graphlytic has a tutorial with a video showing how to install their tool as a graph app in Neo4j Desktop.
- David Allen and others from Neo4j will be at Kafka Summit at the end of September. If you are attending, be sure to come say hello!
- yWorks released a new version of yFiles for Java with a superb integration with Neo4j. Be sure to check out the changes.
Tweet of the Week
My favourite tweet this week was by Melly Burns:
Getting to learn about graph databases (@neo4j ) for my job today. Love days you get to go completely outside the normal day to day work to expland knowledge and create a more creative environment.
Expanding knowledge is fun! #Coding #fun
— Melly Burns ? PAX (@TheMellyBee) August 8, 2019
Don’t forget to RT if you liked it, too.


