Hi graphistas,
This week’s video is from a new series about Spring Data Neo4j by Gerrit Meier.
Adam Cowley announced the launch of Charts, we launched the new Neo4j 4.0 certification, and Hantsy concludes the Spring Data Neo4j series by showing how to write custom queries.
And finally, Jesús Barrasa builds a graph of the UNESCO Thesaurus.
Cheers, Mark and the Developer Relations team
Featured Community Member: Chuck Frisbie
This week’s featured community member is Chuck Frisbie.

Chuck Frisbie – This Week’s Featured Community Member
Chuck is a Principal Sales Engineer at Sisense, where he’s been working for the last 5 years. Prior to that, he worked as a Solutions Consultant at Axis Group, where he was a certified QlikView developer. He has a Bachelor of Science in Nuclear Engineering from Penn State University.
Chuck recently presented Turbocharging Advanced Analytics with Sisense and the Neo4j Connector for BI at the Neo4j Connections: Graph Architecture and Integrations event.
In the talk, using a dataset from the Metropolitan Museum of Art, Chuck shows how to build an interactive analytics application.
Spring Data Neo4j 6 – Episode 0
Our video this week is from a new Spring Data Neo4j Series by Gerrit Meier.
In the first video, Gerrit shows how to install Neo4j, import the movies graph, and then query it using the Neo4j Java driver.
Creating Charts from your Graphs

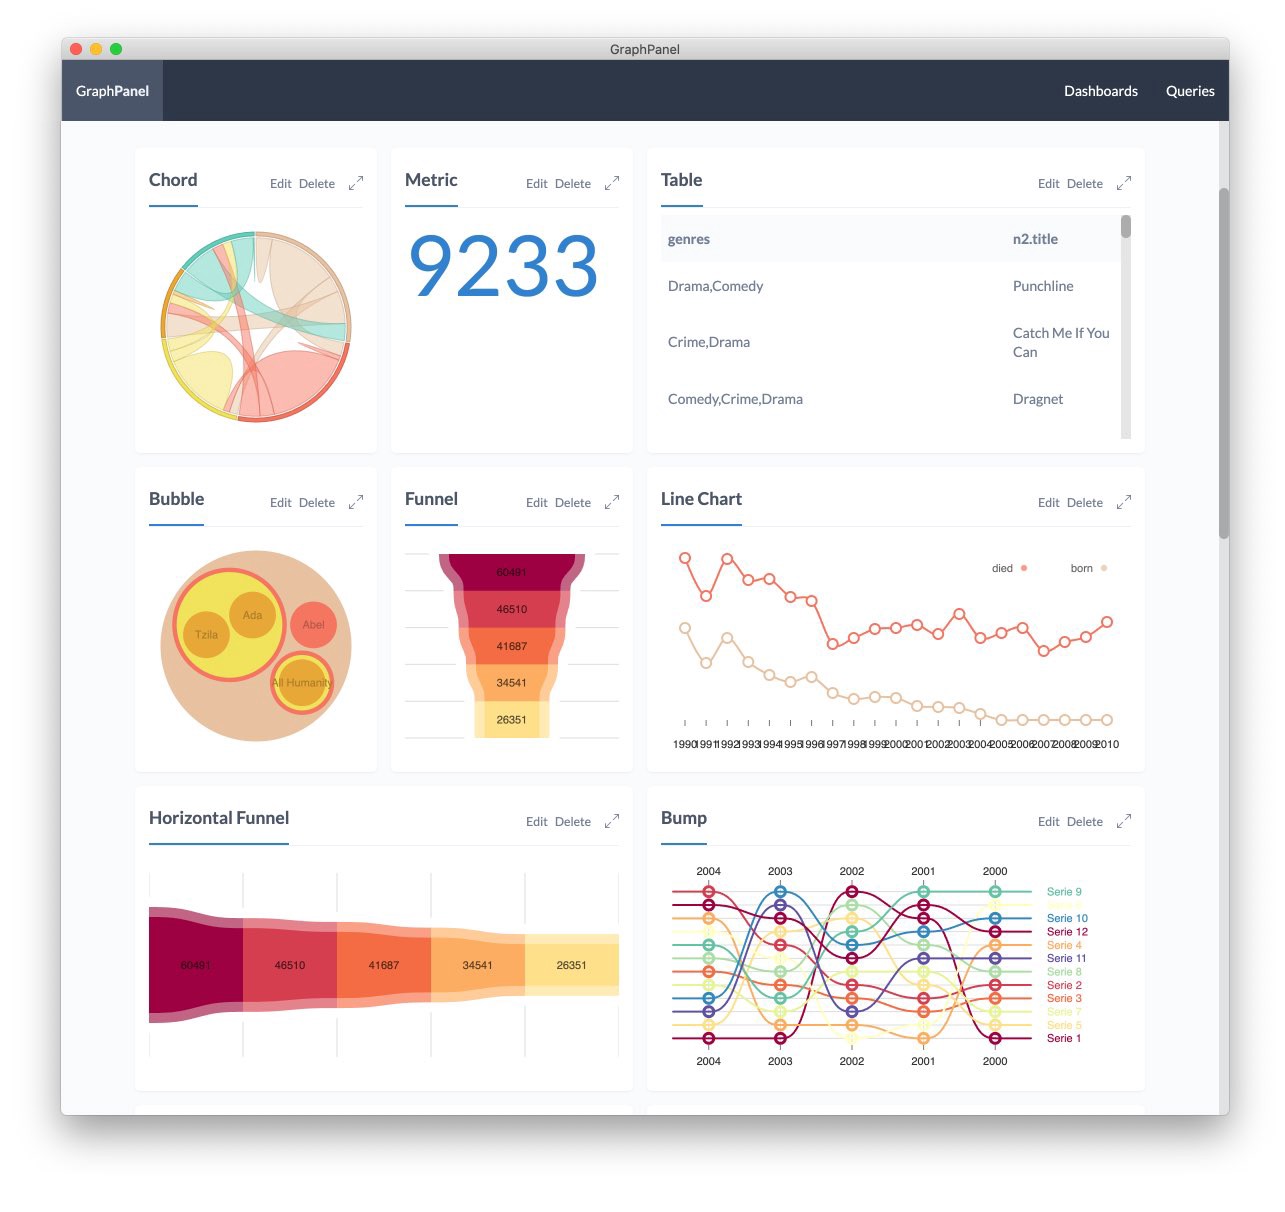
Adam Cowley announced the launch of Charts, a Neo4j Graph App that makes it easy to create charts on top of your graph data.
Charts has a visual query builder that generates the queries the charts are based on. Those queries can then be used in dashboards to create tables, bar charts, line charts, and more.
Customizing queries with Spring Data Neo4j

Hantsy continues the series of blog posts showing how to use Neo4j with Spring Boot.
In the fourth post, Hantsy shows how to write our own custom queries using the @Query annotation in Spring Data Neo4j.
Neo4j 4.0 Certification exam, Entity Extraction, Reads on the Causal Cluster Leader

- Elaine Rosenberg launched the new Neo4j 4.0 Certification exam. It’s 30 questions, you’ve got 45 minutes, what are you waiting for?!
- We published a new developer guide showing how to build an entity graph with APOC NLP.
- Lju Lazarevic published a hands-on crash course introduction to Neo4j.
- Chris Skardon explains how a new config setting in Neo4j 4.2 makes it possible to execute read queries on the leader of a causal cluster.
- Sebastian Müller and Jiros published a video showing how to export data from the CovidGraph visualisation tool as Cypher queries.
- BruteShark released version v1.1.2, which is now compatible with Neo4j for visualizing network diagram by analyzing PCAP file connections.
- Linkurious Enterprise released version 2.9.10, which is now compatible with Neo4j AuraDB.
- Elaine Rosenberg announced the launch of the updated Using a Machine Learning Workflow for Link Prediction training course. This course now works with Neo4j 4.0.
QuickGraph#12 Working with a Multilingual Thesaurus

It’s been almost a year since the last QuickGraph, but Jesús Barrasa is back with QuickGraph #12, in which he graphs the UNESCO Thesaurus.
After showing how to import the thesaurus using n10s, Jesús shows how to make sense of the data using pure Cypher queries, as well as the GDS Library.
Tweet of the Week
My favourite tweet this week was by Estelle Scifo:
One week ago, I had never heard of abstract syntax trees. Now, I see them everywhere! (python -> Cypher, GraphQL -> Cypher, …)
— Estelle Scifo (@st3llasia) December 1, 2020
Don’t forget to RT if you liked it too!


