Hi everyone,
In this week’s video, Dr Jim Webber talks about the growing importance of Graph Data Science.
Pavan Kumar Kattamuri visualises Google Cloud IAM, Papa Yaw Ofori-Afriyie gives us an intro to graph databases, and Rik Van Bruggen published The Lockdown Anniversary session of Graphistania.
And finally, Sixing Huang analyses genomes using graphs
Cheers, Mark and the Developer Relations team
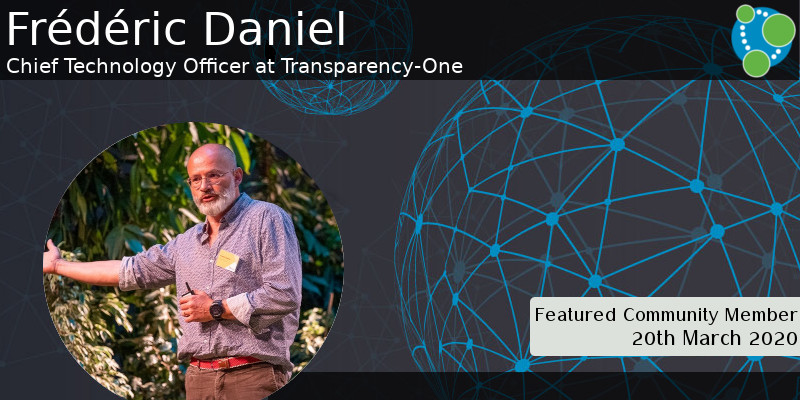
Featured Community Member: Frédéric Daniel
This week’s featured community member is Frédéric Daniel.

Frédéric Daniel – This Week’s Featured Community Member
Frédéric is the Chief Technology Officer at Transparency-One, who make supply chain software that helps businesses create a healthier, safer, and more sustainable world for consumers. He’s been in the software industry for more than 20 years and previously worked at SAP, BusinessObjects, and Deloitte & Touche.
Frédéric’s colleagues at Transparency-One have presented on their use of graphs at multiple GraphConnect conferences, and Frédéric himself recently presented Leveraging Graphs for Sustainable and Responsible Sourcing at the Graphs for Risk Mitigation in Supply Chains Connections event.
In the talk, Frédéric explains why graphs are great at querying supply chains and takes us through some of the questions that they’ve been able to answer.
The Growing Importance of Graph Data Science
Our video this week is a two part interview about Graph Data Science with Dr Jim Webber, Neo4j’s Chief Scientist.
In part 1, Jim defines Graph Data Science and explains the benefits that it provides to Data Scientists. He also covers some popular use cases. In part 2, Jim describes the tools that comprise the graph platform and shares his experiences getting businesses started with graphs.
Exploring Neo4j by visualizing Google Cloud IAM hierarchy
Pavan Kumar Kattamuri has written a blog post showing how to use Neo4j for identity and access management.
Pavan visualises some dummy data which replicates Google Cloud IAM resource hierarchy, roles, permissions and Identities. He then writes queries to find the roles associated with users and service accounts.
Analyzing Genomes in a Graph Database

Sixing Huang explains how to compile, compare and analyze KEGG functional orthologs (KO numbers) inferred from all described bacterial species genomes using graphs.
After importing the data using Cypher’s LOAD CSV command, Sixing explores the data using both Cypher queries and the Neo4j Bloom visualisation tool.
Graphistania: The Lockdown Anniversary session, Refactoring Graphs, Performance Testing

- In the latest episode of Graphistania, Rik and Stefan go through all the graph content produced since the first Coronavirus lockdowns in March 2020.
- Lju Lazarevic shows how to refactor a graph model.
- NaveenKumar Namachivayam published neo4j-locust, a library that helps you to performance test Neo4j from Locust.
Demystifying Graph Databases

Papa Yaw Ofori-Afriyie gives us an introduction to graph databases with the help of graph containing Uncle Kojo’s family tree.
Papa shows how the graph model contrasts with a relational model and also describes use cases where graphs excel.
Tweet of the Week
My favourite tweet this week was by Axel Morgner:
The @structr 4.0 release will include many important steps and upgrades (GraalVM, Neo4j 4.x). Although not very visible on the surface, it will open the doors to many new features for 4.x and 5.x. Exciting times ahead!
— Axel Morgner (@amorgner) March 16, 2021
Don’t forget to RT if you liked it too!


