Hello, fellow nodes!
It’s been a busy week in the world – in general and at Neo4j! We hope everyone is staying safe out there and finding new and creative ways to engage and contribute. We have a variety of opportunities coming up for projects, events, and content, and we hope to (virtually) see you there!
Our GraphTour Europe is going digital. Join us in Mar 26 in Paris, Mar 31 in Rome and on Mar 30 for the Rome pre-meetup.
This week we announce the Graphs4Good Hackathon, look at Cypher Projections in the Graph Data Science Library, learn about Cypher Tuning, and a found lot of cool articles, projects and repositories.
Featured Community Members: Nikita Wootten and Eric Solender
This week’s featured community members Eric (CTO) and Nikita (Chief Data Scientist) work at the startup Mindstand in Catonsville, MD (just the place my wife Tina spent a year as an exchange student in ’92). At Mindstand they work on a safety management tool that detects online harassment, hate speech, and other troubling behaviors.

Nikita Wootten, Eric Solender – This Week’s Featured Community Member
As many other Go users, they wanted to connect their applications to Neo4j without a c-binding and so couldn’t use the official driver. They took the driver that John Nadratowski had started a while ago and rewrote the internals, upgraded the supported bolt protocol, added an OGM ((example) and a Cypher DSL. Pretty impressive work. You find their Go driver implementation here, with more documentation and an introductory article to follow.
Thanks a lot Eric and Nikita for all your hard work, looking forward to the feedback from our Go user community and collaboration with the drivers team.
Join the Graphs4Good GraphHack
Leading up to Leonard Euler’s birthday on April 15, we encourage all of you to join or realize an idea that makes our world a better place. We can definitely need it in these times.
Just create a GitHub project and sign up, then we can highlight your project and hopefully others will chime in.
We will have demos around the world of the projects submitted during Global Graph Celebration Day and will showcase them as well.
Please read the blog post and get started, have a really creative weekend!
NODES 2019: Improve Cypher Performance with the Query Log Analyzer
In this week’s video from the NODES 2019 online conference, Kees Vegter shows us how to monitor and improve Cypher performance with the query log analyzer graph app. You can install the application in Neo4j Desktop through the Graph App Gallery.
The query log analyzer takes the query log from Neo4j and shows different charts and statistics about the queries run on the instance. There are a variety of views for viewing costly or intensive queries, as well as filtering for specific user queries and timelines. The video covers how Neo4j processes a Cypher query, as well, before diving into strategies and things to watch for in optimizing. Kees has also written up more about the tool and how to use it on our developer blog.
If you want to learn a bit more about how Cypher and Neo4j work and a few steps to take in optimizing queries, this video is a great resource!
Hands-on Twitch Stream: Neo4j Sandbox
New to Neo4j or want to gain some hands-on experience? Lju is here to help with a virtual, hands-on session with Neo4j on March 25th! No download or technical experience is required. You’ll learn about graph data, Cypher, and then get some time and steps to put you well on your way to graphista status!
I will be doing a hand's on session on graph databases, no experience or download required! Join me on https://t.co/gceM3uUBUd on 25th Mar, 11am GMT. This is a perfect opportunity for all teenagers and adults alike to learn about this powerful technology. Spread the word!
— Lju Lazarevic (@ElLazal) March 20, 2020
Whether you are a student, employee, or anything in between, this session will be fun and educational. Join us on March 25th at 11AM (GMT) to learn how to get started with Neo4j!
How to use Cypher projection on a Lord of the Rings social network

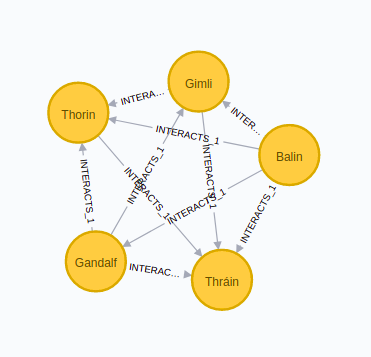
Tomaz continues his tale by tackling the topic of Cypher projection with updated syntax using a dataset near and dear to my heart – Lord of the Rings. In this post, he shows how to import the data into the graph, then explains Cypher projection and steps through loading the whole graph and parts of the graph (with Cypher projection) into memory.
From there, we see how to run a variety of algorithms and analysis on our projection and how to remove one projection and create others. Weakly-connected components, random walk, triangle count and clustering coefficient, and categorical pagerank are all discussed and covered to help us understand how they work and what the code syntax and results are like. The code is even all published on Github, so check it out!
Quick Links:

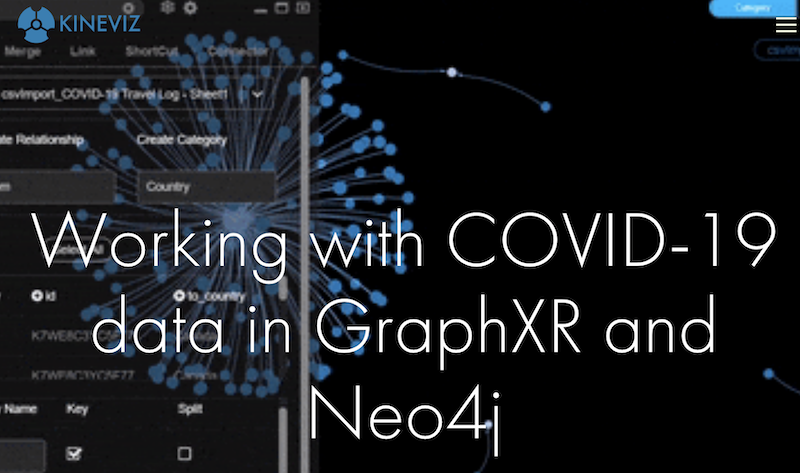
- Our friends from Kineviz continued their impressive work around visualizing the impact and spread of COVID-19 also including text analysis and migration patterns
- Joshua Görner created an Metabolic Query Generator for self-teaching: “Human biology is tough ?- but learning about it isn’t anymore”
- Dave Voutila published part 3 of the PaySim series Analyzing First Party Fraud with Neo4j with a really cool application of the graph data science library
- Speaking of fraud detection, Max de Marzi shows the data creation and application of weakly connected components on a fraud graph
- Martin Preusse started a blog for biomedical applications of Neo4j e.g. gene-id mapping, he created also a covid-19 + population data sandbox
- Mayur Bansal created a Knowledge Graph and Recommendation System for Lego Sets
- Jan Zak our featured member from 3 weeks ago, published the 2nd part of his blog post on high performance graph visualizations with PIXI.js
Tweet of the Week
In this week’s coolest tweet, Will Reynolds shows how to use space bounding info to find shortest travel paths between doors/open boundaries. Video included and a short explainer thread.
This is something I've been thinking about for a while: using space bounding info to find shortest travel paths between doors/open boundaries. Video below shows steps (quickly) to achieve this for Revit model once pushed to #neo4j with #buildinggraph, and some Dynamo nodes. pic.twitter.com/tTIj0OjLP7
— Will (@d2liYmxl) March 16, 2020
Please share and like it if you think it’s cool. Btw. Will gave a really impressive talk at last year’s NODES 2019 conference.


