Back to work/school!
I’m back from time off with the family and I assume so are many of you. Hope you had time to recharge, disconnect, and meet some real people for a change.
This week I have a lot of great things to share.
Our featured community person this week is Shiny Zhu, our newest team member out of Shanghai. Lju gives an overview of what’s in store for our training week. Ashleigh Faith and David Meza are exploring their favorite graph algorithms in a joint video. Suadeo is a mobile recommendation engine app based on Neo4j powered by your friends’ watching behavior.
Appsflyer’s policy-based authorization services are explained by Olga Kogan. Ghislain Atemezing shares the slides from Semantic Conf covering a Knowledge Graph Browser based on Neo4j using RDF to property graph mapping. Bryant Avey explains and demonstrates in detail how to integrate Power BI with Neo4j using our HTTP-Endpoint to execute Cypher queries and how to visualize graph data science-enriched stock trading data.
And finally, we have a long list of releases and updates that came together in the last few days.
Don’t forget to join our Forums or Discord Chat to discuss this news and any other graph topic.
Enjoy this week’s update,
Cheers,
Michael
Featured Community Member: Shiny Zhu
This week’s featured community member is Shiny Zhu.

Shiny Zhu – This Week’s Featured Community Member
I’m super excited about Shiny Zhu joining our team as our first Developer Advocate in Asia Pacific, out of Shanghai, China.
Shiny has an impressive history. He’s a full stack developer, was very active in the .Net and Python communities, and is a long-time Microsoft MVP.
Even before joining Neo4j, he was active in our graph community, learned and shared news and updates about Neo4j, attended the Shanghai meetup, and even got certified.
Shiny already hit the ground running establishing a Neo4j presence in CSDN and publishing his first two articles on representing a flight data model in a graph in English and Chinese.
So it would be great if you followed him on social media, and please reach out to him with questions and suggestions for topics, events, content, and more.
Coming up: Neo4j Training Week September 13-17
First of all, I wanted to remind you of our upcoming training week.
Lju wrote a great article covering the topics.
These super interactive, live classes will help you get started with:
- Neo4j, the graph database
- AuraDB Free, our cloud service
- Bloom graph visualization and exploration
- GraphQL integration for Neo4j to build APIs quickly
- Knowledge graphs using NLP and GDS (Graph Data Science)
Please join one of the sessions or share the opportunity with your colleagues, friends, and family – no one is too young or old to enjoy the power of graphs.
Authorization Solutions for Microservices Architecture
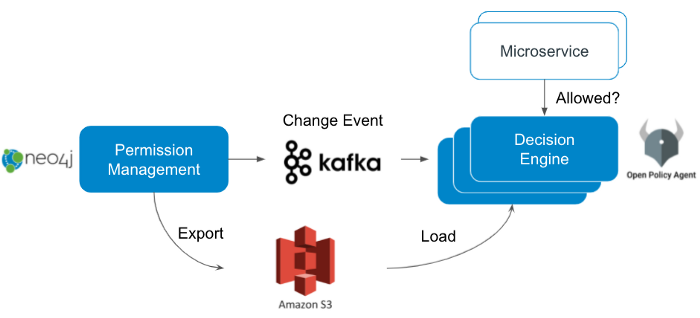
Architect Olga Kogan, from our customer AppsFlyer, shares the company’s approach to securely managing Microservices.
AppsFlyer manages insights data for APIs and mobile services. They use Neo4j as part of the access control and authorization service that’s used for each microservice – as a global approach at the REST API layer is not fine-grained enough. And their needs are very specific due to privacy, legal, and data sensitivity requirements.
They use a policy-based access control (PBAC) with the Rego scripting language from Open Policy Agent (OPA), a CNCF project to implement a more flexible approach that can use different pieces of contextual information to request authorization decisions.
Neo4j serves as the permission management engine that allows real-time policy and permission changes for each customer, partner, and service/action.
Suadeo – What Are You Watching?

We were really impressed by Suadeo, a Neo4j backed free mobile app for iOS and Android that allows you to share what you watch with your friends and build (suadeo-)lists of interesting shows and movies recommended by your peers.
Neo4j community member mbazos spent a year in the Neo4j world learning and building the app and is happy to release it now – and is interested in your feedback!
Check Out the App
Slides: Knowledge Graph Browser for a Property Graph in Neo4j
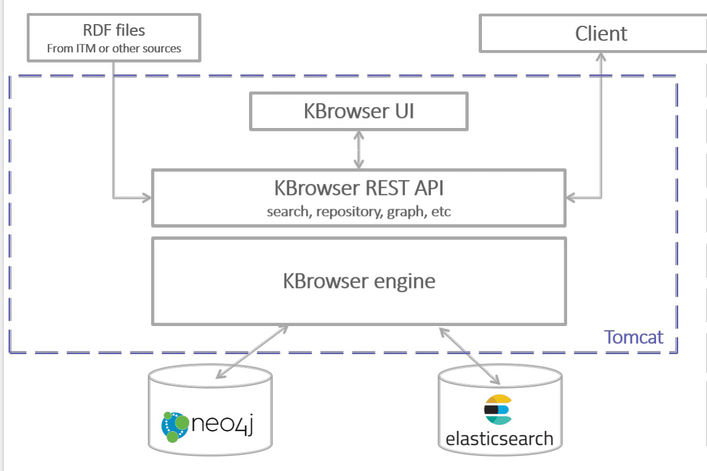
Ghislain Atemezing from Mondeca (Paris) shared the slides from Semantics Conf (Amsterdam) on how they publish and browse a knowledge graph using Neo4j.
RDF subjects are mapped to nodes in the graph, and predicates (triples and literals) to relationships (which is not the ideal model as it’s too fine-grained and doesn’t utilize the “property” graph for the literals). They built an infrastructure for a Knowledge Graph Browser using Spring, Neo4j, and Elastic. There are some live deployments to explorate at https://mef-prod.mondeca.com/index
Favorite Graph Algorithms From Our Favorite Friends
Two of our favorite contributors are back for a joint feature.
Join Ashleigh Faith and David Meza while they explore their favorite graph algorithms of the graph data science library in this 15-minute video with a calming river in the background.
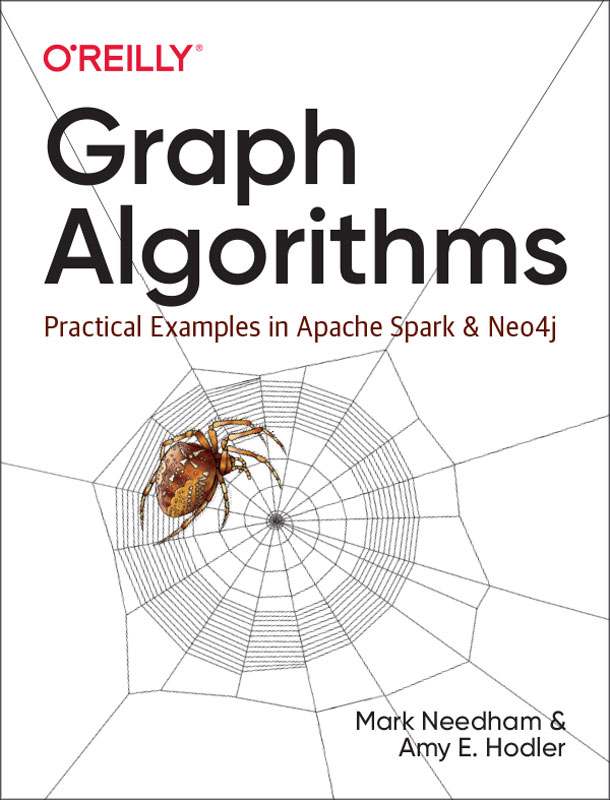
They introduce the book Graph Algorithms: Practical Examples in Apache Spark & Neo4j and explore one algorithm per chapter. They go through the book’s background and history, and explain each of the algorithms and how to use it, and show examples in Spark and Neo4j.
Here are the algorithms they are talking about:
- Path-Finding: All-Pairs-Shortest Paths
- Centrality: Betweenness Centrality (finding bridges between clusters)
- Clustering: Triangle Counting + Clustering Coefficient (interconnectedness)
- Clustering: Louvain
- Machine Learning: Graph Embeddings
Visualize Stock Volume Similarity with Neo4j, GDS, and Power BI

Bryant Avey explains in his article how to surface patterns detected in a Neo4j graph automatically in Power BI by running PowerQuery templates that auto-refresh and execute multiple Cypher queries in bulk.
He uses the daily stock price history data from TD Ameritrade, represented as a linked list of history nodes.
The raw data was enriched by using the GDS KNN algorithm to find similarities between stock trade volumes across different stocks and days, and then running Louvain to show clusters of similar groups of nodes.
In PowerBI, the similarity and volume data was explored using timeline analytics and candlestick charts to identify temporal patterns of price and later volume correlations visualized in correlation charts.
He presented the approach at the Power BI bootcamp, which is really cool.
In a previous article, he showed how to load data from Neo4j into Power BI using the HTTP API and custom PowerBI templates for executing the POST requests with Auth and custom result parsing.
Quick Hits and Releases

- The preview release of the GDS library 1.7.0 is available with new maximum k-cut algorithm, ML pipelines, Cypher on the in-memory graph, and progress/monitoring improvements. We’d love to get your feedback, so please check it out.
- Rob Brennan shared the code of how he learned to build a dockerized Neo4j typescript backend serving an GraphQL API to an Next.js front-end with Tailwind deployed to Vercel.
- GraphAware previews their neo4j-config-cli which allows the automation of Neo4j configurations like indexes, RBAC, data seeds, and more.
- Adnan Shabbir from LinuxHint wrote a detailed blog post on how to install, configure, and use Neo4j on Ubuntu.
- Adam Cowley added support for the storing configuration of the “Charts” graph app in your database so you can reuse and share it. Try it out.
- Graphileon released the 4th iteration of their Visual Query Builder, which allows displaying and filtering on edge property values. Watch the short video.
- The Neo4j JDBC driver 4.0.3 was released by Florent Biville. It puts the baseline JDK back to Java 8 and now supports the full list of the Neo4j connection schemes.
- Bloom 1.8.1 was released with a few small bug fixes. The Bloom 1.8 release with datetime support and other features went out a few weeks ago.
- Version 4.3.2 of the .Net driver has been released by the drivers team.
- Neo4j 4.2.11 came out this week with neo4j-admin, browser-fullscreen, and some kernel fixes.
Tweet of the Week
My favorite tweet this week was by Dion Jansen, who shared how to turn an GraphML file into a graph using Python.
+1 for yEd. Used small Python script to interpret the .graphml (which is in XML) from yEd to create a graph in Neo4j. pic.twitter.com/m7ZEjgSMgq
— Dion Jansen (@di0nj) September 1, 2021
Don’t forget to RT if you liked it too!


