Health care analytics is an analysis activity that can be undertaken as a result of data collected from four areas within healthcare:
- Claims and Cost Data
- Pharmaceutical and Research and Development (R&D) Data
- Clinical Data (collected from electronic medical records (EHRs))
- Patient Behavior and Sentiment Data (patient behaviors and preferences, (retail purchases — e.g. data captured in running stores).
Health care analytics is a growing industry and is expected to grow to even more with time.

The connected data capabilities of a graph database can help us achieve what is either impossible or complicated with the traditional relational databases, other NoSQL databases, or even big data solutions like Pig and Hive.
Demo Use Case
I have developed a self-explanatory example use case to explain the capabilities of Graph Database in healthcare. In the demo guide, we are performing data ingestion and analytics of the FDA Adverse Event Reporting System Data.
The FDA Adverse Event Reporting System (FAERS or AERS) is a computerized information database designed to support the U.S. Food and Drug Administration’s (FDA) post-marketing safety surveillance program for all approved drug and therapeutic biologic products.
The FDA uses FAERS to monitor for new adverse events and medication errors that might occur with these products. It is a system that measures occasional harms from medications to ascertain whether the risk–benefit ratio is high enough to justify continued use of any drug and to identify correctable and preventable problems in health care delivery (such as the need for retraining to prevent prescribing errors).
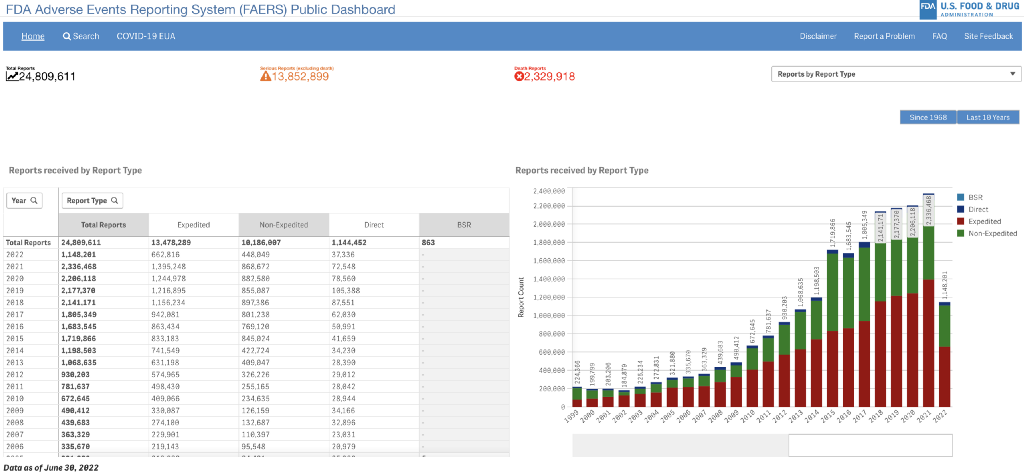
Reporting of adverse events from the point of care is voluntary in the United States. The FDA receives some adverse event and medication error reports directly from health care professionals (such as physicians, pharmacists, nurses, and others) and consumers (such as patients, family members, lawyers, and others).
Health professionals and consumers may also report these events to the products’ manufacturers. If a manufacturer receives an adverse event report, they are required to send the report to the FDA as specified by regulations.
Data, Modeling, and Graph Ingestion
We downloaded one of the publicly available FDA FAERS datasets, and massaged and articulated the demographics for the United States. FAERS data is traditional RDBMS-based tabular data. We translate it to a Graph-based data model.
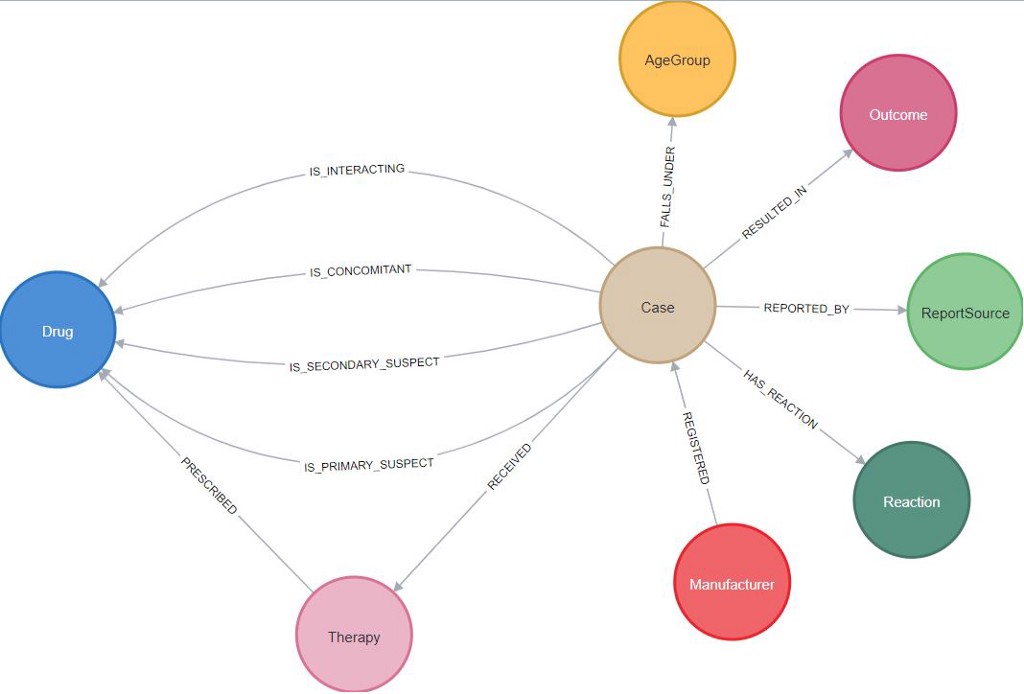
Next, we perform data ingestion to prepare the FAERS graph and run a few example analytics queries to see the interesting output. Some interesting queries are:
- What are the top five drugs reported directly by consumers for the side effects?
- What top ten drug combinations have the most side effects when consumed together?
- What age group reported the highest side effects, and what are those side effects?
- What are the most common side effects reported in children and what drugs caused these side effects?
You’ll notice these queries are truly analytical in nature — additionally, they cannot be easy to prepare and produce with a traditional RDBMS data and querying language. With Neo4j and the power of Cypher, this becomes extremely easy.
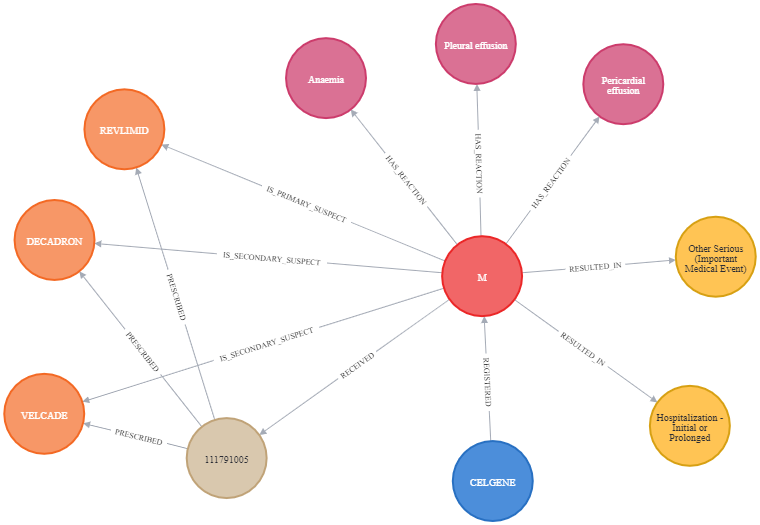
Readymade Neo4j Sandbox for FDA FAERS exploration
We have a pre-deployed Neo4j sandbox to walk you through this example of Healthcare Analytics. Neo4j Sandbox is a great — and free — online tool that lets you try Neo4j’s graph database without installing anything locally.
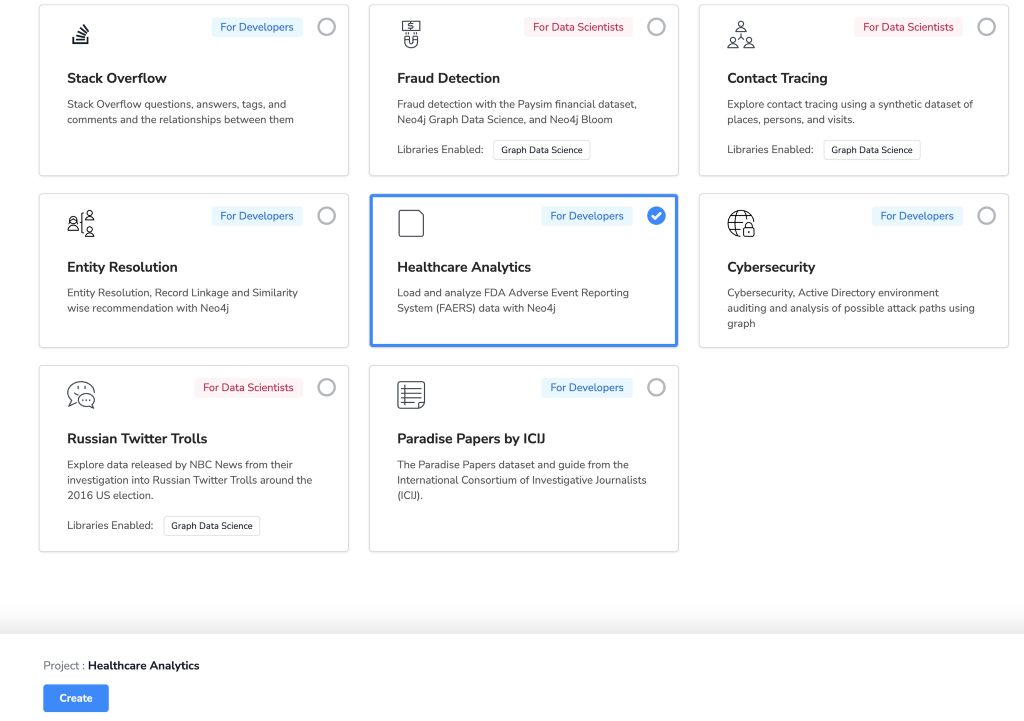
Get started with your own healthcare analytics sandbox.
Full source code for this example and guide is available on GitHub.
References
FDA Adverse Event Reporting System Wiki
Healthcare Analytics Sandbox: Load and Analyze FDA Adverse Event Reporting System Data with Neo4j was originally published in Neo4j Developer Blog on Medium, where people are continuing the conversation by highlighting and responding to this story.


