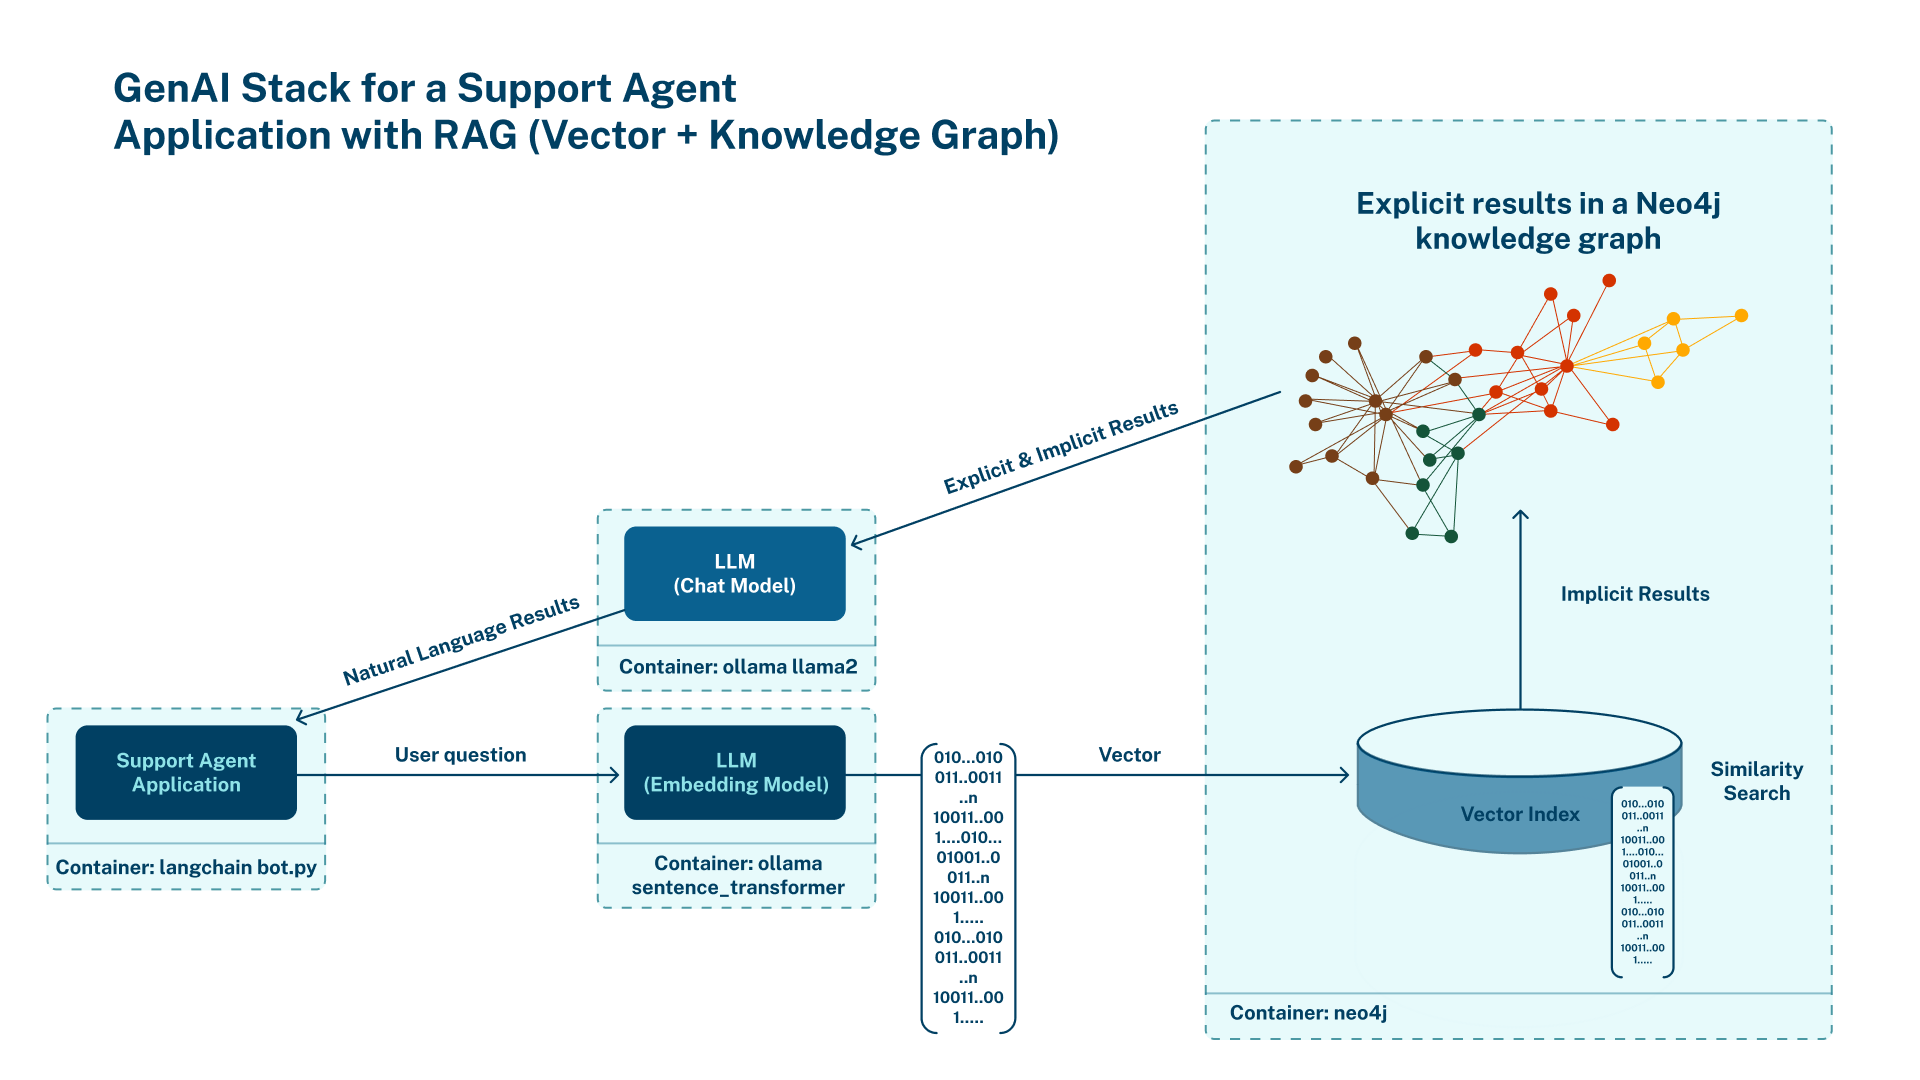
The team at Neo4j and WhyHow.AI explores how graph and vector search systems can work together to improve retrieval-augmented generation (RAG) systems. Using a financial report RAG example, we explore the differences in response between graph and vector search, benchmark the two types of answer outputs, show how depth and breadth can be optimized through graph structures, and discover why combining graph and vector search is the future of RAG.
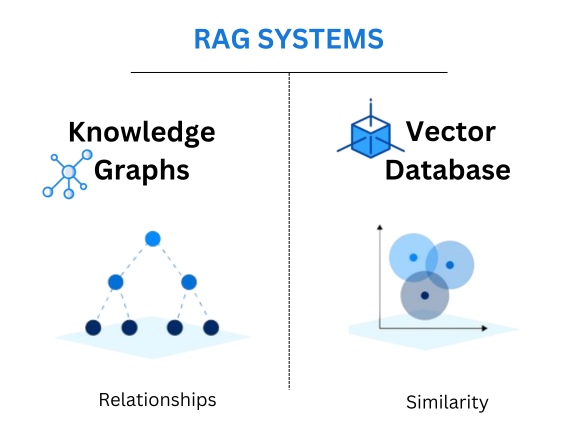
Graph databases like Neo4j are built on the concept of a graph: a collection of nodes and relationships. Nodes represent individual data points, while relationships define the connections between them. Each node can possess properties, which are key-value pairs providing additional context or attributes about the node. This approach offers a flexible and intuitive way to model complex relationships and dependencies within data. Knowledge Graphs have frequently been referred to as similar to how the human brain works. Graphs enable explicit relationships to be stored and queried against — reducing hallucinations and increasing accuracy through context injection.
Knowledge graphs store data and the connections between data points, enhancing reasoning and extraction capabilities by providing a comprehensive view of all relevant information. This also presents the benefit of explainability as the data being relied upon within a graph is visible and traceable.
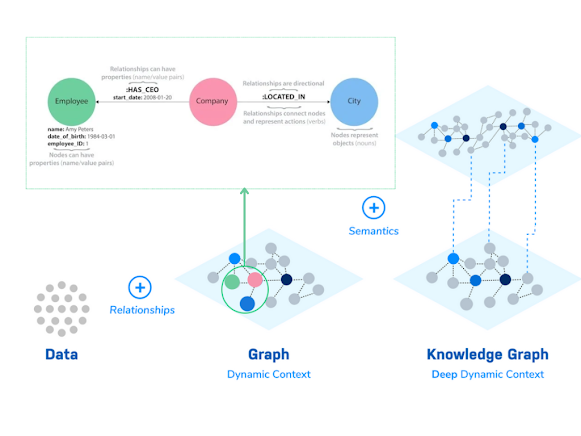
This capability is particularly beneficial in fields like financial analysis, where understanding the intricate relationships among financial metrics, market conditions, and business entities is crucial.
For instance, a graph database can connect diverse pieces of information, such as executive statements, financial results, and market conditions, in a coherent model that mirrors real-world interactions. This allows financial analysts to explore complex scenarios, such as the impact of macroeconomic changes on specific product lines, by navigating the graph to see direct and indirect influences. Using Cypher, Neo4j’s graph query language, we can discover intricate relationships in knowledge graphs, such as the impact an influencer has on a product:
def explore_impact_on_product(graph, product_name):
    query = """
    MATCH (p:Product {name: $product_name})<-[r:IMPACTS]-(m)
    RETURN m.name AS Influencer, r.description AS ImpactDescription
    """
    result = graph.run(query, product_name=product_name)
    for record in result:
        print(f"Influencer: {record['Influencer']}, Impact: {record['ImpactDescription']}")
In business scenarios, decision-makers can see how isolated data points are connected. A graph could illustrate how changes in supplier dynamics affect production schedules, inventory levels, and financial outcomes. The flexibility of graph structures allows them to adapt dynamically as new data types and relationships are introduced without requiring significant redesigns of the underlying database schema.
Using Depth and Breadth Graph Search
Vector search, commonly used in RAG, finds semantically similar words and phrases and returns that information to the LLM to construct an answer to a question. Vector search is a powerful way of bringing some relevant types of information that could be relevant to a question. For example, a question around “What pets did John have?” can retrieve information about John’s cat or dog, as it can be derived that ‘cat’ and ‘dog’ are potentially semantically similar to ‘pets’. This means that such words do not have to be explicitly linked together to the concept of ‘pets’ before being retrieved. However, many pieces of information may be semantically similar but not relevant, or relevant but not semantically similar.
Graph search presents specific levers and patterns that can be optimized for greater, granular control in information retrieval. For queries that require deeper levels of information retrieval within a specific direction of inquiry, graphs can facilitate navigation through layers of relationships, enabling in-depth analysis of specific patterns. Conversely, graphs can allow retrieval across a broad set of adjacent relationships for queries seeking a broader perspective on the data and focusing on the overall scope of information.
This can be seen as akin to vertical (deep/depth) and horizontal (broad/breadth) traversal within a graph.
Evaluating Graph and Vector Search Through a Financial Report RAG
Let us explore the application of graph and vector search in a financial information retrieval system, looking at a quarterly financial report for Apple.
Financial analysts grapple with complex queries concerning company performance, market trends, and product insights. Consider an analyst tasked with evaluating the impact of foreign exchange rates on iPhone revenue over several quarters. Such a question requires understanding product performance, financial health, and external economic factors.
By converting earnings call transcripts into a structured format that outlines the relationships among financial metrics, products, and market conditions, knowledge graphs provide a comprehensive view of company performance. This structured approach allows analysts to perform quick and precise analyses, offering deeper insights into how different business segments interact and influence each other, thus enhancing strategic investment decision-making. A graph structure lets you directly extract key data entities and their neighboring entities.
The code below allows us to take an entity’s name, retrieve its neighbors, (related nodes) and install dependencies:
pip install numpy pyvis neo4j openai


from neo4j import GraphDatabase
from typing import Optional, Union, List, Dict
import numpy as np
from openai import OpenAI
from pyvis.network import Network


def get_embedding(text, model="text-embedding-3-small"):
    client = OpenAI()
    text = text.replace("\n", " ")

    return client.embeddings.create(input = [text], model=model).data[0].embedding


def calculate_similarity(embedding1, embedding2):
    # Placeholder for similarity calculation, e.g., using cosine similarity
    # Ensure both embeddings are numpy arrays for calculation
    return np.dot(embedding1, embedding2) / (np.linalg.norm(embedding1) * np.linalg.norm(embedding2))


class NodeSimilaritySearchMan():

    def __init__(self, neo4j_driver: GraphDatabase):
        """
        Initialize the NodeSimilaritySearchMan with a Neo4j driver instance.


        Args:
            neo4j_driver (GraphDatabase): The Neo4j driver to facilitate connection to the database.
        """
        self.driver = neo4j_driver

    def find_relationship_neighbors(self, node_name: str) -> List[Dict[str, Union[int, str]]]:
        """
        Finds neighbors of a given node based on direct relationships in the graph.


        Args:
            node_name (str): The name of the node for which to find neighbors.


        Returns:
            List[Dict[str, Union[int, str]]]: A list of dictionaries, each representing a neighbor with its ID and name.
        """

        result = self.driver.execute_query(
            """
            MATCH (n)-[r]->(neighbor)
            WHERE n.name = $node_name
            RETURN  neighbor.name AS name,
                type(r) AS relationship_type
            """,
            {"node_name": node_name}
        )


            neighbors = [{ "name": record["name"],
                        "relationship_type": record["relationship_type"]} for record in result]
        return neighbors


    def visualize_relationship_graph_interactive(self,neighbors, node_name,graph_name, edge_label='relationship_type'):
        # Initialize the Network with cdn_resources set to 'remote'
        net = Network(notebook=True, cdn_resources='remote')

        # Add the main node
        net.add_node(node_name, label=node_name, color='red')

        # Add neighbors and edges to the network
        for neighbor in neighbors:
            title = neighbor.get('neighbor_chunks_summary', '')
            if edge_label == 'similarity':  # Adjust title for similarity
                title += f" (Similarity: {neighbor[edge_label]})"
            else:
                title += f" ({edge_label}: {neighbor[edge_label]})"
            net.add_node(neighbor['name'], label=neighbor['name'], title=title)
            net.add_edge(node_name, neighbor['name'], title=str(neighbor[edge_label]))


        net.show(f'{graph_name}_graph.html')
        return net
We retrieve the nodes that are related to “Apple”:
driver = GraphDatabase.driver(uri=url,auth=(user,password))
query_obj = NodeSimilaritySearchMan(driver)
neighbors_by_relationship = query_obj.find_relationship_neighbors("Apple")
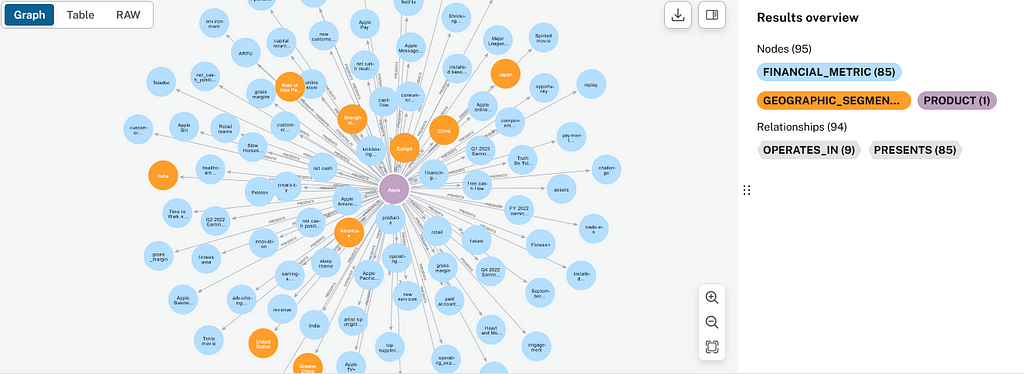
To understand the difference between graph and vector search, we will use the WhyHow.AI SDK for knowledge graph generation since it allows us to generate knowledge graphs from PDF files directly. The WhyHow SDK is a powerful tool designed to streamline the construction of knowledge graphs. This SDK allows users to create, manage, and query well-scoped knowledge graphs efficiently, enabling businesses to organize and use their data in ways they care about.
With the WhyHow SDK, users can construct a knowledge graph from a predefined schema. A schema in this context defines the structure of the knowledge graph by specifying the types of relevant entities (nodes), the kinds of relationships (edges) that link these entities, and the patterns that these relationships should follow. This method provides a high degree of control, allowing users to tailor the knowledge graph to their specific needs, ensuring that the graph accurately reflects the relationships inherent in the raw data.
By defining a schema, users specify exactly what elements and connections the knowledge graph should contain. This could include anything from characters and objects in a literary analysis to products and user interactions in a business application. The schema ensures that the constructed graph maintains consistency and relevance to the defined context, making it a powerful tool for extracting meaningful insights from complex documents.
First, we initialize the WhyHow client and add the documents we want to represent in the graph to our namespace:
from whyhow import WhyHow
import os
from dotenv import load_dotenv
load_dotenv()


user = os.getenv("NEO4J_USERNAME")
password = os.getenv("NEO4J_PASSWORD")
url = os.getenv("NEO4J_URL")


client = WhyHow(neo4j_user=user,neo4j_password=password,neo4j_url=url)


# Define namespace name
namespace = "apple-earning-calls"


documents = [
     "earning-calls-apple/Apple (AAPL) Q1 2023 Earnings Call Transcript _ The Motley Fool.pdf",
    "earning-calls-apple/Apple (AAPL) Q2 2022 Earnings Call Transcript _ The Motley Fool.pdf",
    "earning-calls-apple/Apple (AAPL) Q4 2022 Earnings Call Transcript _ The Motley Fool.pdf"
]


# Add documents to your namespace
documents_response = client.graph.add_documents(
  namespace = namespace, documents = documents
)
Second, we define our desired schema for the graph:
{
  "entities": [
    {
      "name": "Company",
      "description": "The company discussed in the document, specifically Apple Inc."
    },
    {
      "name": "Financial_Metric",
      "description": "Quantitative measures of Apple's financial performance, including revenue, gross margin, operating expenses, net cash position, etc."
    },
    {
      "name": "Product",
      "description": "Physical goods produced by Apple, such as iPhone, Mac, iPad, Apple Watch."
    },
    {
      "name": "Service",
      "description": "Services offered by Apple, including Apple TV+, Apple Music, iCloud, Apple Pay."
    },
    {
      "name": "Geographic_Segment",
      "description": "Market areas where Apple operates, such as Americas, Europe, Greater China, Japan, Rest of Asia Pacific."
    },
    {
      "name": "Executive",
      "description": "Senior leaders of Apple who are often quoted or mentioned in earnings calls, like CEO (Tim Cook), CFO (Luca Maestri)."
    },
    {
      "name": "Market_Condition",
      "description": "External economic or market factors affecting Apple's business, such as inflation, foreign exchange rates, geopolitical tensions."
    },
    {
      "name": "Event",
      "description": "Significant occurrences influencing the company, including product launches, earnings calls, and global or regional economic events."
    },
    {
      "name": "Time_Period",
      "description": "Specific time frames discussed in the document, typically fiscal quarters or years."
    }
  ],
  "relations": [
    {
      "name": "Reports",
      "description": "An executive discusses specific financial metrics, typically during an earnings call."
    },
    {
      "name": "Impacts",
      "description": "Describes the influence of events or market conditions on financial metrics, products, services, or geographic segments."
    },
    {
      "name": "Operates_In",
      "description": "Denotes the geographic areas where Apple's products and services are available."
    },
    {
      "name": "Presents",
      "description": "Associates products or services with their financial performance metrics, as presented in earnings calls or official releases."
    },
    {
      "name": "Occurs_During",
      "description": "Connects an event with the specific time period in which it took place."
    },
    {
      "name": "Impacted_By",
      "description": "Shows the effect of one entity on another, such as a financial metric being impacted by a market condition."
    },
    {
      "name": "Offers",
      "description": "Indicates that the company provides certain services."
    },
    {
      "name": "Influences",
      "description": "Indicates the effect of strategies or innovations on various aspects of the business."
    }
  ],
  "patterns": [
    {
      "head": "Executive",
      "relation": "Reports",
      "tail": "Financial_Metric",
      "description": "An executive reports on a financial metric, such as revenue growth or operating margin."
    },
    {
      "head": "Event",
      "relation": "Impacts",
      "tail": "Financial_Metric",
      "description": "An event, like a product launch or economic development, impacts a financial metric."
    },
    {
      "head": "Product",
      "relation": "Presents",
      "tail": "Financial_Metric",
      "description": "A product is associated with specific financial metrics during a presentation, such as sales figures or profit margins."
    },
    {
      "head": "Product",
      "relation": "Operates_In",
      "tail": "Geographic_Segment",
      "description": "A product is available in a specific geographic segment."
    },
    {
      "head": "Event",
      "relation": "Occurs_During",
      "tail": "Time_Period",
      "description": "An event such as an earnings call occurs during a specific fiscal quarter or year."
    },
    {
      "head": "Financial_Metric",
      "relation": "Impacted_By",
      "tail": "Market_Condition",
      "description": "A financial metric is affected by a market condition, such as changes in foreign exchange rates."
    },
    {
      "head": "Company",
      "relation": "Offers",
      "tail": "Service",
      "description": "Apple offers a service like Apple Music or Apple TV+."
    },
    {
      "head": "Service",
      "relation": "Influences",
      "tail": "Market_Condition",
      "description": "A service influences market conditions, potentially affecting consumer behavior or competitive dynamics."
    }
  ]
}
Then we use the schema we just defined to generate a graph:
schema = "../schemas/earnings_schema.json"
extracted_graph = client.graph.create_graph_from_schema(
  namespace = namespace, schema_file = schema
)
print("Extracted Graph:", extracted_graph)
Inside our Neo4j instance, we can observe the following graph being created.
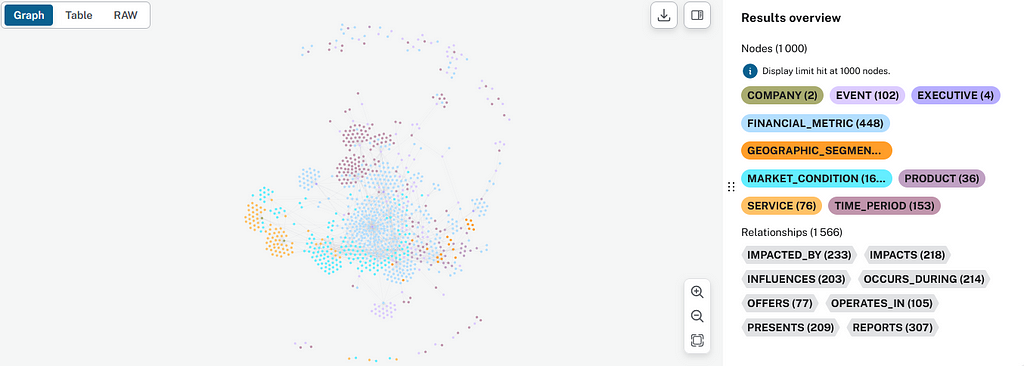
The nodes and relationships are the entities and the relations defined in the schema, respectively, and the patterns are the actual relationships that compose the graph we observed.
At the same time, we have defined a retrieval chain, which uses a vector index to store the same documents as vector representations, and the GPT-4 model for question-answering over these docs. We also implement Rerank from Cohere to optimize the retrieval pipeline:
from langchain_community.document_loaders import PyPDFLoader
from langchain_openai import OpenAIEmbeddings
from langchain_community.vectorstores import FAISS
from langchain_openai import OpenAIEmbeddings
from langchain_core.output_parsers import StrOutputParser
from langchain_core.runnables import RunnablePassthrough
from langchain_openai import OpenAIEmbeddings
from langchain import hub
from langchain_openai import ChatOpenAI
from langchain_community.document_loaders import PyPDFDirectoryLoader
from langchain.retrievers.document_compressors import FlashrankRerank
from langchain.retrievers import ContextualCompressionRetriever
import os
from langchain import PromptTemplate, LLMChain
from langchain_cohere import CohereRerank
from cohere import Client
from dotenv import load_dotenv
load_dotenv()
cohere_api_key = os.getenv("COHERE_API_KEY")
co = Client(cohere_api_key)
class CustomCohereRerank(CohereRerank):
    class Config():
        arbitrary_types_allowed = True

CustomCohereRerank.update_forward_refs()

def format_docs(docs):
    return "\n\n".join(doc.page_content for doc in docs)

def query_vector_db(query,faiss_index):

    retriever = faiss_index.as_retriever()
    compressor = CustomCohereRerank(client=co)
    compression_retriever = ContextualCompressionRetriever(
    base_compressor=compressor, base_retriever=retriever
    )
    template = """You are a helpful assistant who is able to answer any question using the provided context. Answer the question using just the context provided to you
    question: {question}
    context: {context}
    Provide a concise response with maximum three sentences"""
    prompt = PromptTemplate(template=template,
                            input_variables=["context","question"])
    llm = ChatOpenAI(model="gpt-4")
    rag_chain = LLMChain(prompt=prompt,llm=llm)
    docs = compression_retriever.invoke(query)
    context = format_docs(docs)
    answer = rag_chain.invoke({"question":query,"context":context})
    return answer

def index_docs_vectordb(path):

    loader = PyPDFDirectoryLoader(path)
    pages = loader.load_and_split()
    faiss_index = FAISS.from_documents(pages, OpenAIEmbeddings())
    return faiss_index

# index docs
path = "earning-calls-apple" # the path to the folder containing the PDF documents
index = index_docs_vectordb(path)
Finally, we define two functions — query_vectordb and query_graph — to query the vector store and the graph, respectively:
def query_vectordb(query):
    answer = query_vector_db(query,index)
    return answer

def query_graph(query,namespace):
    query_response = client.graph.query_graph(namespace, query)
    return query_response.answer
Answer Completeness and Limitations of Graph and Vector Querying
Completeness refers to the system’s ability to provide all relevant information about a query without missing significant details. Due to their relational nature, graph databases can provide comprehensive answers by performing exhaustive searches of all interconnected data. Conversely, although efficient in finding similar chunks of text, vector indices might not always capture a complete view of the broader context or the interrelationships between data points. Imagine we need a complete view of all market conditions directly impacting Apple’s Mac product line. This could include economic factors, supply-chain issues, competitive dynamics, and more. We can define a GraphQueryManager class to retrieve this information:
from neo4j import GraphDatabase
class GraphQueryManager:
    def __init__(self, uri, user, password):
        self.driver = GraphDatabase.driver(uri, auth=(user, password))
    def close(self):
        self.driver.close()
    def get_impacting_market_conditions(self, product_name):
        with self.driver.session() as session:
            result = session.run("""
            MATCH (n)-[r:IMPACTS]->(m) WHERE m.name=$product_name AND n.namespace="apple-earning-calls"
            RETURN n.name as Condition, r.description as Description, m.name as Product
            """, product_name=product_name)
            return [{"Condition": record["Condition"], "Description": record["Description"], "Product": record["Product"]} for record in result]

# Usage
graph_manager = GraphQueryManager(url, "neo4j", password)
conditions = graph_manager.get_impacting_market_conditions("Mac")
graph_manager.close()
When we query the graph, we retrieve all market conditions that have impacted the Apple Mac, allowing us to include all market conditions relevant to the product. This produces the following list of market conditions:
for condition in conditions:
print(f"- {condition['Condition']}","\n")
- COVID-19
- foreign exchange
- macro environment
- macroeconomic outlook
- Market Condition
- product
- services
- softening macro
- PC industry
- iPhone
- revenue
- silicon shortage
- strong March results
- product launch
- sellout conditions
- tightness in the supply chain
- COVID disruptions
- foreign currency
- market condition
- macroeconomic headwinds
- macroeconomic outlook
- COVID-related impacts
- FX headwinds
- digital advertising
- gaming
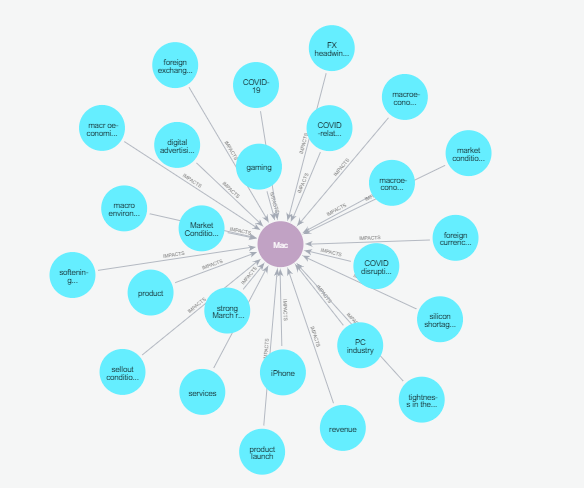
Each item is tagged as impacting the Mac based on structured relationships in the graph database. This direct linkage ensures that the information is relevant and precisely targets the query’s intent.
Running the same query over our vector store-based chain may yield a less complete answer:
vectordb_conditions = query_vectordb(
"what are the market conditions that impact Mac products?")
print(vectordb_conditions)
The market conditions that impact Mac products include foreign exchange headwinds, significant supply constraints, and the macroeconomic environment.
Unlike the graph search, the vector search does not inherently understand or convey the relationships between different market conditions and their impact on the Mac. It provides text chunks that must be further analyzed to understand any connections. This means that essential information may get overlooked during this analysis, leading to inconsistent answers over time. Without a relationship-based structure to highlight and enumerate a comprehensive set of relevant concepts, generating a complete response with vector search is difficult.
There are, however, limitations of a graph-only search. Graphs simplify and represent the underlying information of a text into triples (i.e., entity — relationship — entity). Such simplification and abstraction of information bears the risk of losing some of the underlying context.
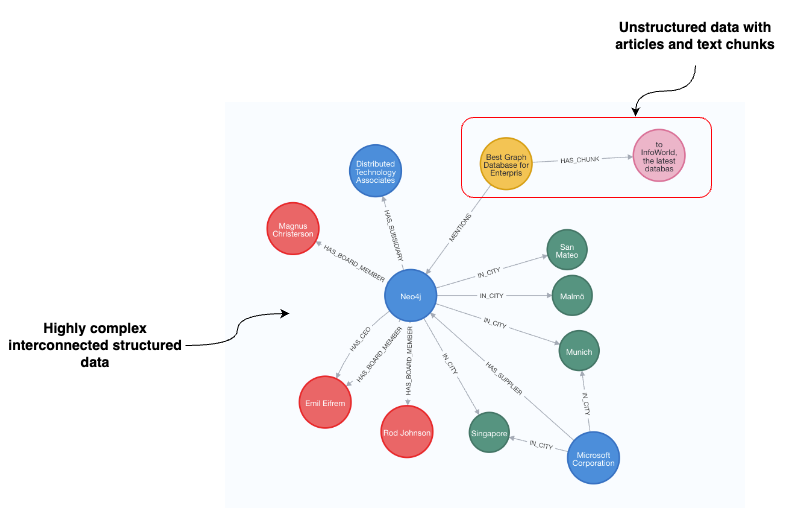
Merging graph and vector-based search using graph structures to uncover relevant vector chunks is a great way of combining deterministic navigation and context-aware vector chunk data storage and retrieval. An example is shown below and further explained in Neo4j’s article about graph-based metadata filtering.
“We see value in combining the implicit relationships uncovered by vectors with the explicit and factual relationships and patterns illuminated by graphs,” Emil Eifrem, Co-Founder and CEO of Neo4j, said. “Customers, when innovating with generative AI, also need to trust that the results of their deployments are accurate, transparent, and explainable.”
Depth Questions
Implementing depth parameters in Neo4j provides a mechanism for analyzing complex relationships within graph databases. In the following code snippet, we run a query to retrieve the financial metrics reported by Tim Cook and the market conditions that impact them.
The depth parameter is specified in the relationship patterns of the Cypher query. In this case, the depth parameter is indicated by the range *1..20 in both the [:REPORTS] and [:IMPACTED_BY] relationships. This range signifies the minimum and maximum number of hops (or relationships) to traverse from the starting node (‘executive’) to the target nodes (‘financial metric’ and ‘market condition’):
MATCH path = (exec:EXECUTIVE)-[:REPORTS*1..20]->
(metric:FINANCIAL_METRIC)-[:IMPACTED_BY*1..20]->(cond:MARKET_CONDITION)
WHERE exec.name='Tim Cook'
RETURN exec, metric, cond, path
In return, we get the following sub-graph.
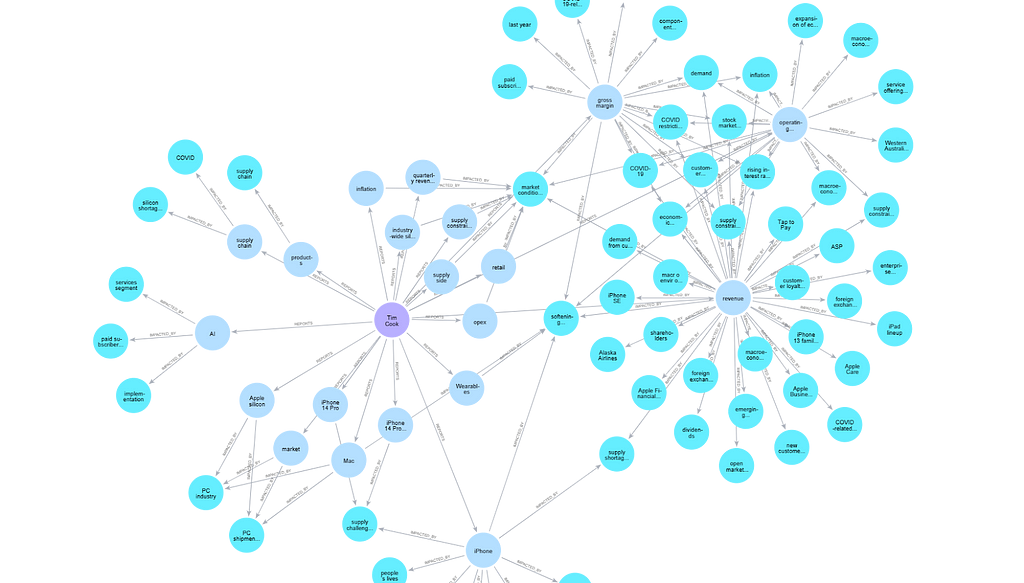
The graph shows the interconnected entities in relation to our query by exploring our specified depth of the graph search. We can also note the graph’s ability to navigate through depth-oriented questions using results returned from querying the graph constructed using the WhyHow SDK while leveraging the latest chunk linking feature, which allows us to retrieve chunks related to nodes in the graph.
from langchain.chat_models import ChatOpenAI
from langchain import PromptTemplate, LLMChain
OPENAI_API_KEY = os.getenv("OPENAI_API_KEY")

def run_chain(question,txt_context):
    template = """ You are a helpful assistant who is able to answer any question using the provided context. Answer the question using just the context provided to you
    Question : {question},
    Context:{context}
    Provide a concise response with maximum three sentences"""
    prompt = PromptTemplate(template=template,
                            input_variables=["context","question"])

    # load the model
    chat = ChatOpenAI(model_name="gpt-4",openai_api_key=OPENAI_API_KEY, temperature=0.0)
    chain = LLMChain(llm=chat, prompt=prompt)
    answer = chain.invoke({"question":question,'context':txt_context})

def query_graph_with_chain(question):
    context = client.graph.query_graph(
    query = question,
    namespace = "apple-earning-calls",
    include_chunks = True
    )
    txt_context = context.answer
    txt = " "
    for chunk in context.chunks:
        for text in chunk.chunk_texts:
            txt += text
    txt_context += txt
    chain_answer = run_chain(question,txt_context)
    return chain_answer['text']

gr = query_graph_with_chain(question['question'])
vc = query_vector_db(question['question'],index)
print("Graph: ", gr)
print("Vector: ", vc['text'])
Question: How did executives describe the impact of consumer behavior changes during the pandemic on Apple’s business model?
- Graph query answer: Executives described the impact of consumer behavior changes during the pandemic as leading to increased demand for Apple’s products and services. This was particularly noted in remote work, online learning, and digital entertainment. Therefore, the pandemic has positively affected Apple’s business model.
- Vector DB answer: During the pandemic, changes in consumer behavior significantly impacted the supply of iPhone 14 Pro and iPhone 14 Pro Max. This led to extended shipping times, which Apple had not anticipated. Additionally, the company saw some impact across its products and services, with the most impact on Mac and Wearables, and the least on the iPhone.
Commentary: The graph query mentioned the specific impact of consumer behavior within specific segments of consumer behavior (remote work, online learning, and digital entertainment). In the vector query, the answer appeared to talk more generically about pandemic-related impact.
Question: How did executive discussions detail the relationship between market conditions and Apple’s financial performance in Greater China?
- Graph query answer: Executive discussions detailed the relationship between market conditions in Greater China and Apple’s financial performance by examining the sales of various Apple products like iPhone, Mac, iPad, and Wearables. They also considered factors such as the installed base and AppleCare. The popularity of specific products like the iPhone 14 Pro and Apple Watch Series 8 was also considered.
- Vector DB answer: The executive discussions detailed the relationship between market conditions and Apple’s financial performance in Greater China by discussing the impact of COVID restrictions and supply constraints on demand and growth. Despite these challenges, Apple saw a marked change in store traffic and demand beginning in December. Furthermore, despite supply shortages, they mentioned a strong cycle for their “Pro” products, indicating their ability to drive consumer choice toward higher-end products.
Commentary: In the graph query, details about the popularity of specific products were mentioned and explored. In the vector query, the answer seemed to talk more generically about pandemic-related impacts, presumably because of the term ‘market conditions’ as opposed to tying it more closely to performance in China specifically.
Question: What detailed strategies did Apple employ to address the competitive challenges in the smartphone market?
- Graph query answer: Apple addressed competitive challenges in the smartphone market through continuous innovation and strong marketing campaigns. They also leveraged exclusive features and fostered brand loyalty among their customers. These strategies helped them to stay competitive in the market.
- Vector DB answer: Apple’s strategies to address competitive challenges in the smartphone market include managing for the long term and adapting quickly to circumstances outside their control. They also invest in innovation, people, and positive societal impact. Other strategies also include creating technology that will enrich customer lives and help unlock their creative potential.
Commentary: In the graph query, the answer was more specific about the types of strategies used (exclusive features and strong marketing campaigns), as opposed to the vector query, which seemed more broad (invest in innovation).
Breadth Questions
Breadth questions require a broad overview, extracting insights across various concepts related to a particular topic. Controlling breadth in our graph queries means we expand or contract the scope our search should be limited to. This allows us to answer questions that require exploring the immediate connections around a node, expanding outward to see how many different nodes or types of nodes a starting node is connected to directly.
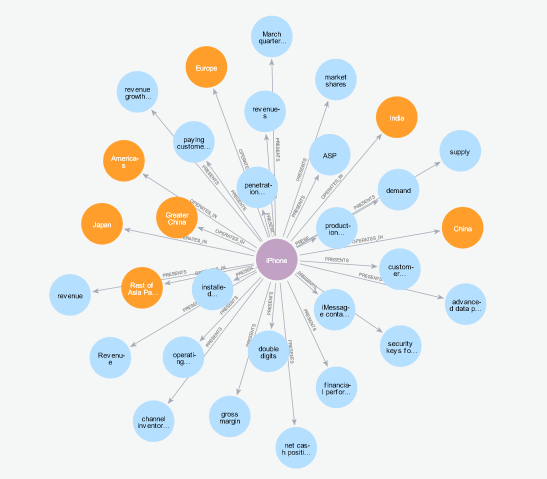
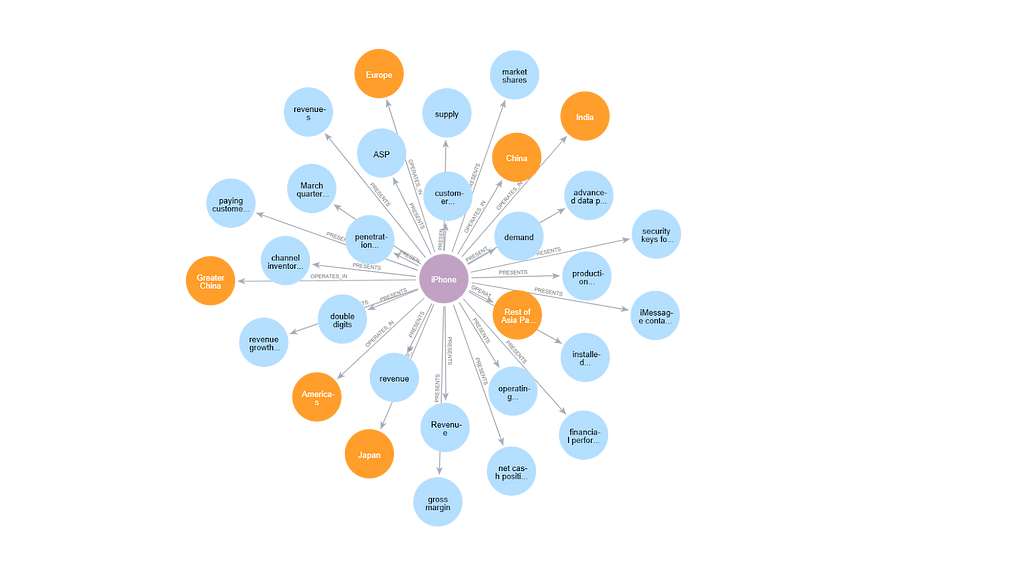
Within this graph, you can feed this information into an LLM to perform post-processing and determine which data points are most relevant by looking up through semantic similarity, identifying specific relationship types we want to track, or specific node types.
For example, if by the relationship type:
MATCH (n:PRODUCT)-[r]->(m)
WHERE n.name="iPhone"
RETURN n, r, m
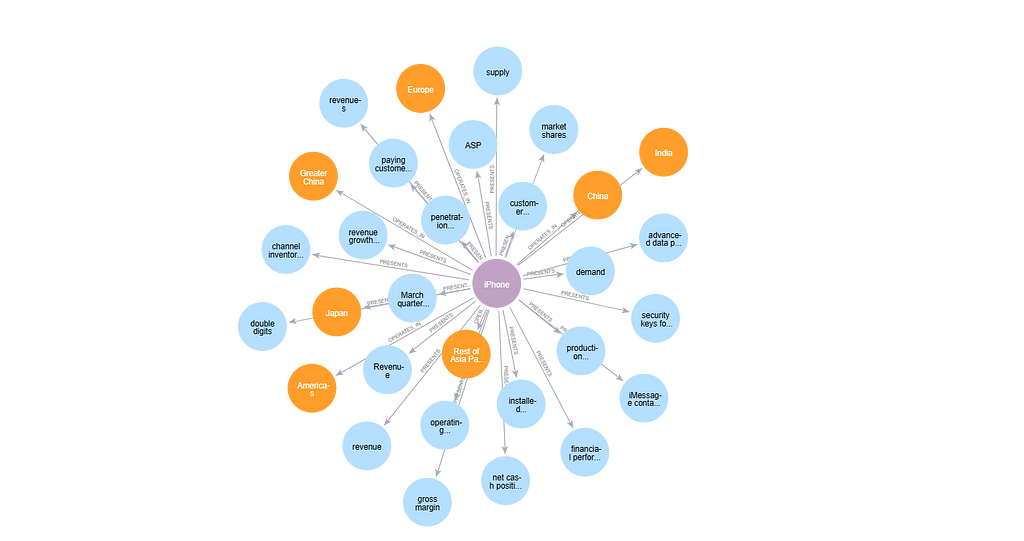
Or by the node types:
MATCH (n:PRODUCT)-[r]->(m)
WHERE (m:GEOGRAPHIC_SEGMENT OR m:FINANCIAL_METRIC) AND n.name="iPhone"
RETURN n, r, m
Question: How does Apple balance technological innovation with cost management in its product development?
- Graph query answer: Apple balances technological innovation with cost management by heavily investing in research and development for creating advanced products. They also optimize their supply-chain efficiency to manage costs. Additionally, they negotiate favorable pricing with their suppliers to keep costs low.
- Vector DB answer: Apple balances technological innovation and cost management in its product development by adapting to rising component costs and other market conditions. They manage the net of rising and falling component costs, trying to navigate the challenging environment effectively. Apple also continues to invest in innovation and people, focusing on delivering technology that will enrich their customers’ lives and help unlock their creative potential.
Commentary: The graph query answer mentions specific actions like supplier negotiations and supply-chain management. The Vector DB answer is more vague as to ‘navigation of [a] challenging environment’ and ‘investing in innovation’.
Depth and Breadth Questions
Questions that require exploring the graph’s depth and breadth are often encountered in real-world scenarios. These questions require an understanding of deep conceptual information, as well as how that information relates to other concepts.
Graph databases allow us to combine both types of search in our graph queries, making retrieving complex sub-graphs with rich insights easier.
In our use case, imagine we want to find out how Apple’s strategic decisions impact its financial metrics across different geographic segments over a series of quarters and how these metrics influence product development strategies. We could structure a graph query that represents these interconnected relationships among these entities:
MATCH (exec:EXECUTIVE)-[r1:REPORTS]->(metric:FINANCIAL_METRIC),
(metric)-[r2:IMPACTED_BY]->(cond:MARKET_CONDITION),
(prod:PRODUCT)-[r3:PRESENTS]->(metric),
(prod)-[r4:OPERATES_IN]->(geo:GEOGRAPHIC_SEGMENT),
(event:EVENT)-[r5:OCCURS_DURING]->(time:TIME_PERIOD),
(event)-[r6:IMPACTS]->(metric)
WHERE exec.name IN ['Tim Cook', 'Luca Maestri'] AND
geo.name IN ['Americas', 'Europe', 'Greater China'] AND
time.name IN ['Q1 2023', 'Q2 2023', 'Q3 2023']
RETURN exec, metric, cond, prod, geo, event, time, r1,r2,r3,r4,r5,r6
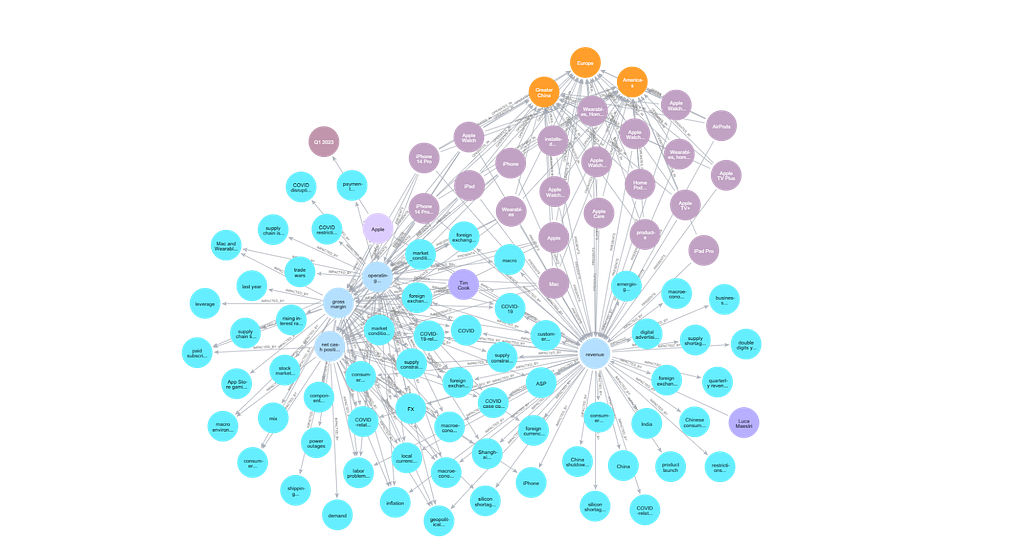
WhyHow’s chunk linking feature comes into action for these types of questions by allowing us to use both the nodes and their corresponding chunks to provide complete context to an LLM.
Question: What specific strategies did Tim Cook outline during the Apple Q4 2022 Earnings Call to mitigate investor worries about the deceleration of technology expenditure growth, particularly in relation to Apple’s product innovation and market expansion plans?
- Graph query answer: During the Apple Q4 2022 Earnings Call, Tim Cook presented strategies to alleviate investor concerns about the slowdown in tech spending growth. He emphasized continuous innovation with the introduction of new features in products like the iPhone 14 and iPad Pro, aimed at maintaining market leadership and customer interest. Cook also highlighted Apple’s growth in emerging markets such as India and Latin America, which is crucial for expanding its customer base and sales. Furthermore, he stressed the enhancement of services like Apple Music and the company’s commitment to sustainability, including efforts towards carbon neutrality and using recycled materials, which resonate well with environmentally conscious stakeholders.
- Vector DB answer: During the Apple Q4 2022 Earnings Call, Tim Cook addressed concerns about slowing tech spending by emphasizing ongoing innovation in products like the iPhone 14, expanding into emerging markets, enhancing services like Apple Music, and focusing on sustainability efforts.
Commentary: In the graph query answer, we can see that the strategies mentioned span multiple geographies and product lines, while going deeper into mentioning specific countries or the purposes of specific strategies. Although some parts are mentioned in the vector DB answer, the answer is less exhaustive (breadth) and less detailed (depth).
Depth and Breadth as Graph Search Levers to Augment Vector Search
With graph search, breadth and depth can be seen as potential levers for retrieval in a multi-agent system. A coordinator agent can evaluate a question to determine whether it requires more breadth and/or depth in its retrieval. Then the level of breadth or depth can be configured using a discrete range (e.g., 0.0–1.0) as part of a graph query. A recursive retrieval agent can be used to help determine and further evaluate what to keep and remove while traversing the graph horizontally (breadth) or vertically (depth).
Such a specific type of retrieval is difficult to build, especially in a deterministic and accurate way, with vector RAG alone. These types of retrieval patterns demonstrate new opportunities to use graph structures to store data for retrieval, as well as to store semantic structures for navigation of information.
Whether to optimize for breadth or depth depends on and can be customized to the basis of the specific business scenario or the user persona performing the query. For example, a consumer-facing general research platform may be more interested in optimizing for breadth searches initially and, upon discovering the user is traversing deeper into a specific topic, to increasingly optimize for depth search. In contrast, an internal-facing legal RAG platform used by lawyers may optimize more for depth searches from the get-go. Individual personalization of RAG may also be implemented by allowing the search system to optimize for breadth or depth depending on the user’s style and preference.
Conclusion
Graph structures help create levers for breadth and depth for answer retrieval. Using a real-world financial analysis example, we saw that graph structures give far more leverage for creating more complete answers in both depth and breadth. They also create a semantically consistent, accurate, and deterministic way to perform information retrieval. Using graph structures in conjunction with vector search promises a high level of deterministic and complete retrieval, which is crucial for enterprise workflows.
Graph vs. Vector RAG — Benchmarking, Optimization Levers, and a Financial Analysis Example was originally published in Neo4j Developer Blog on Medium, where people are continuing the conversation by highlighting and responding to this story.


