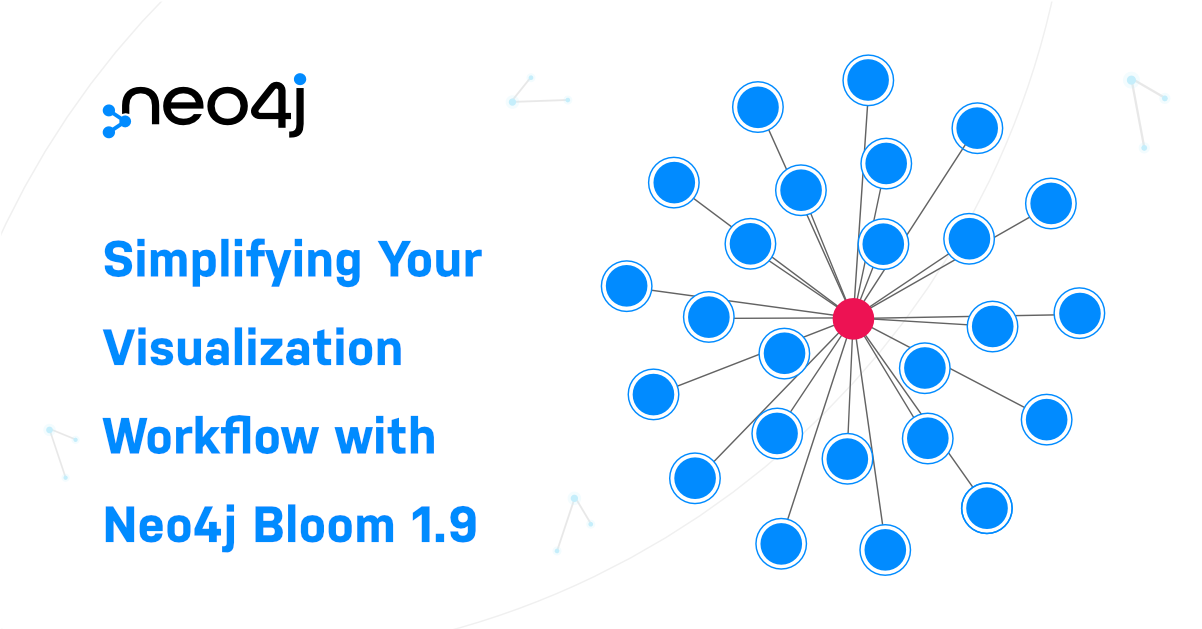
Visualizing Graph Data With Neo4j Bloom
Jul 31 13 mins read
Explore how to visualize graph databases and interact with Neo4j Bloom using the ScoobyGraph example. Read more →
For week 49 of Discover AuraDB Free, you'll learn how to analyze software dependencies with deps.dev. Read more →
This week in Discover Neo4j AuraDB Free, we're exploring git commit history as a graph in AuraDB, starting from scratch. Read more →
In this blog post, we’ll use Neo4j to turn the European Gas Network into a knowledge graph to analyze the data.Photo by Rostislav Artov, UnsplashThe crisis between Ukraine and Russia caused relations between Russia and the E.U. to fall to the lowest… Read more →
This week we welcome the release of Neo4j Bloom 2.1, with the new feature: filtering and rule-based styling based on times and dates. Read more →
Two weeks ago, a colleague asked if I could help him import his personal ancestry data into Neo4j. He sent me a GEDCOM file, and I gave it a try. Read more →
Visualizing graphs is hard. When I started working with graph data, I realized it takes significant work to create intuitive graph visualizations. Thankfully, a ton of tools have been developed that make graph visualization a cakewalk.In this article, I’m zooming… Read more →
Neo4j Browser 4.2.4 launched last week, and with it brings exciting changes to improve your experience when writing and running Cypher queries. The latest Browser is available to use in Neo4j Desktop now and also at browser.graphapp.io. Read more →
Why a Cypher query run in the Neo4j Browser may not return in a reasonable amount of time, what is happening, and what you can do about it.Note: The content of this post is relevant to the Neo4j Browser version 4.2.0… Read more →
While looking for efficient graph visualization libraries for large scale rendering, I came across 3d-force-graph, a really neat wrapper around three.js for graph visualization. Check out that repository after reading this, they have many more examples and settings to explore.I was… Read more →
In this post we explore how to create graph data visualizations that use the results of graph algorithms like PageRank and community detection. Read more →
A graph database stores its data as nodes and relationships each with type and attributes. That makes it easy to represent connected, real world information to find new insights in the data. Read more →