Concepts: NoSQL to Graph
This guide explains how graph databases are related to other NoSQL databases and how they differ.
You need no prior knowledge of other NoSQL databases, although it is helpful to have read the guide on graph databases and understand basic data modeling questions and concepts.
Beginner
Although unhelpfully named, the NoSQL ("Not only SQL") space brings together many interesting solutions offering different data models and database systems, each more suitable than traditional SQL solutions for certain use cases and shapes of data.
With the advent of the NoSQL movement, the "one-size-fits-all" proposition of large relational systems was replaced by conscious decisions about finding the right tool for the job.
Most NoSQL systems are aggregate-oriented, grouping the data based on a particular criterion and the database type (such as document store, key-value pair, etc). This model provides only simple, limited operations and only forms one dedicated view of your data. Focusing on one aggregate at a time allows users to easily spread many chunks of data across a network of machines along the aggregate dimension (for instance, the Document in document databases), but that means that other projections and perspectives have to be computed by crunching or duplicating your data.
Most NoSQL databases store sets of disconnected aggregates. This makes it difficult to use them for connected data and graphs. One well-known strategy for adding relationships to such stores is to embed an aggregate’s identifier inside the field belonging to another aggregate — effectively introducing foreign keys. But, this requires joining aggregates at the application level, which quickly becomes prohibitively expensive.
Other NoSQL databases lack relationships. Graph databases, on the other hand, handle fine-grained networks of information, providing any perspective on your data that fits your use case. The well-known and trusted transactional guarantees from relational systems also protect updates of the graph data in Neo4j, conforming to ACID standards.
Let’s compare the graph data model to other NoSQL models.
Translating NoSQL Knowledge to Graphs
With the advent of the NoSQL movement, businesses of all sizes have a variety of modern options from which to build solutions relevant to their use cases.
-
Calculating average income? Ask a relational database.
-
Building a shopping cart? Use a key-value Store.
-
Storing structured product information? Store as a document.
-
Describing how a user got from point A to point B? Follow a graph.
The chart below shows how each database type stacks up on a spectrum measuring depth and size. While key-value stores can handle massive sizes, they are designed for a high-level view (low depth) of the data. Graph databases retain minimum sizing, even at a greater depth of data than other types of databases. The other types of databases fall somewhere in between those ranges.

Key-Value vs. Graph: Data Model Differences
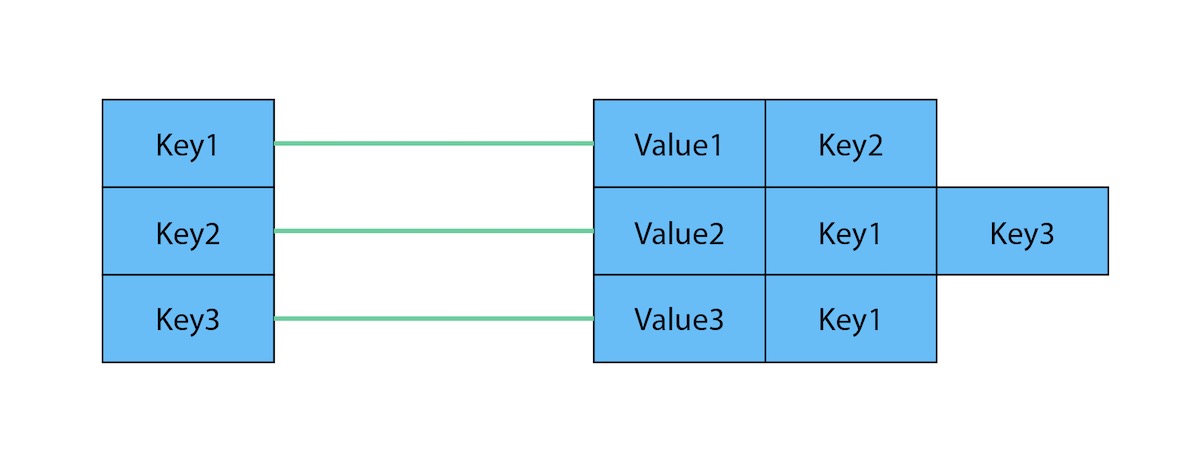
The key-value model is great and highly performant for lookups of huge amounts of simple or even complex values. The image below shows how a typical key-value store is structured.

However, when the values are themselves interconnected, you have a graph. Neo4j lets you traverse quickly among all the connected values and find insights in the relationships. The graph version below shows how each key is related to a single value and how different values can be related to one another (like nodes connected to one another through relationships).

Document vs. Graph: Data Model Differences
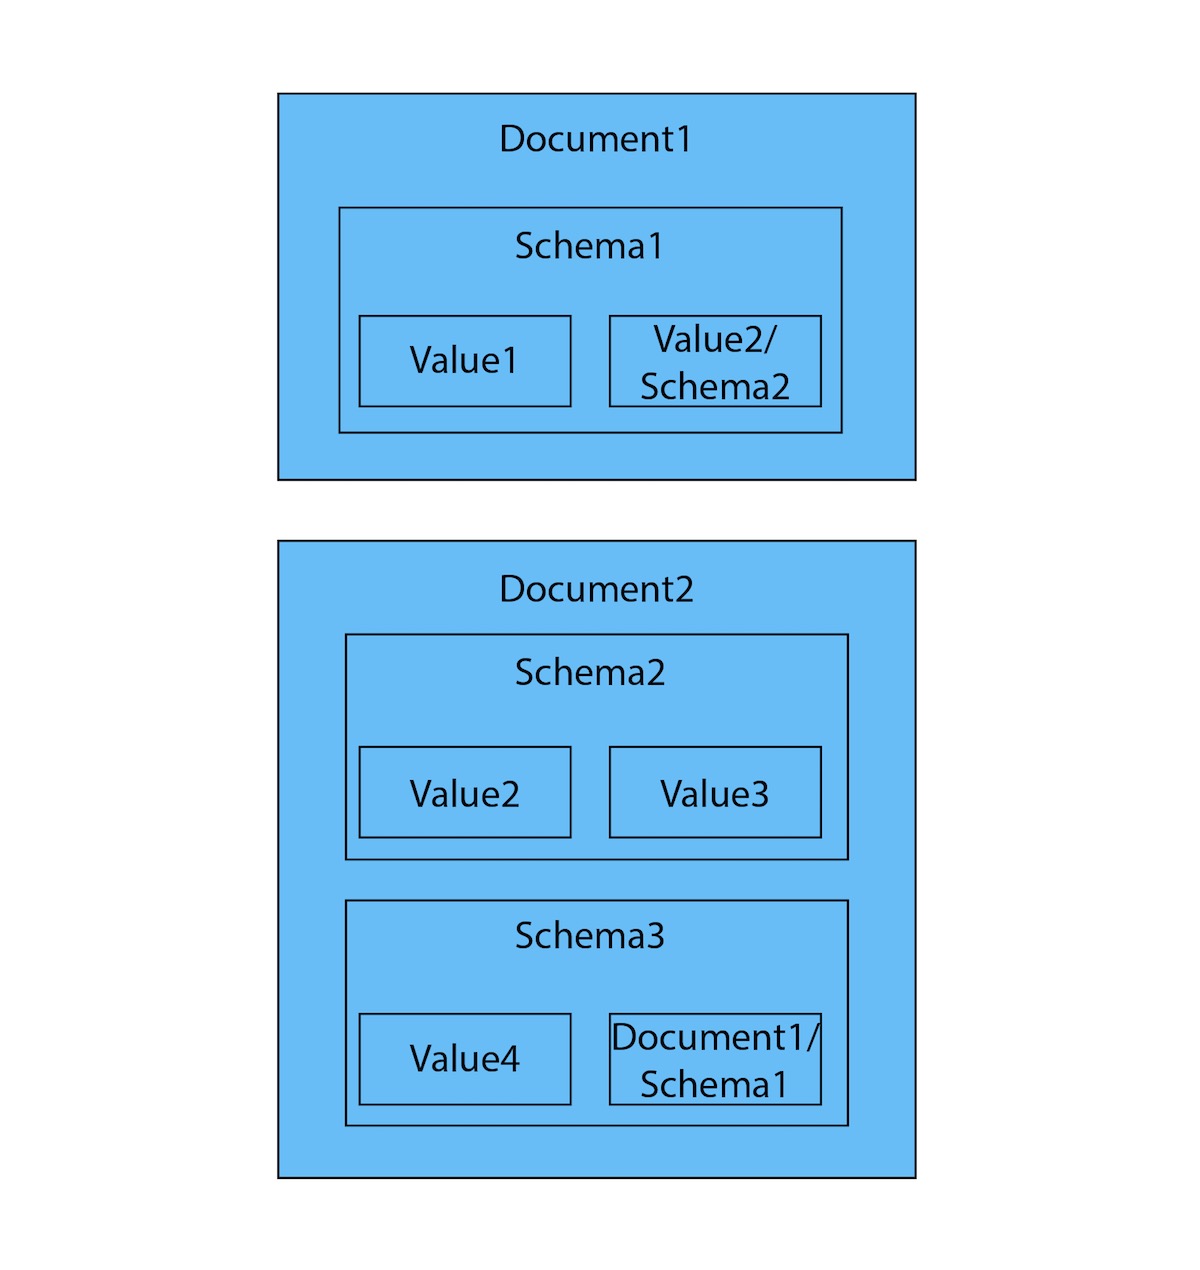
The structured hierarchy of a Document model accommodates a lot of schema-free data that can easily be represented as a tree. Although trees are a type of graph, a tree represents only one projection or perspective of your data. The image below demonstrates how a document store hierarchy is structured as pieces within larger components.

If you refer to other documents (or contained elements) within that tree, you have a more expressive representation of the same data that you can easily navigate using a graph. A graph data model lets more than one natural representation emerge dynamically as needed. The graph version below demonstrates how moving this data to a graph structure allows you to view different levels and details of the tree in different combinations.

Was this page helpful?